Concept
Periodic VWAPs
Periodic VWAPs, also known as weekly, monthly, quarterly, yearly, are Volume & Order Flow concepts. The Library holds 1 implementation, a working definition you can pull into Quant.
Top Periodic VWAPs indicator
The top custom implementation, built on the original standard Periodic VWAPs formula.
1 total
This Periodic VWAPs implementation is strategy-ready: open it in Quant, set your rules, and it backtests automatically.
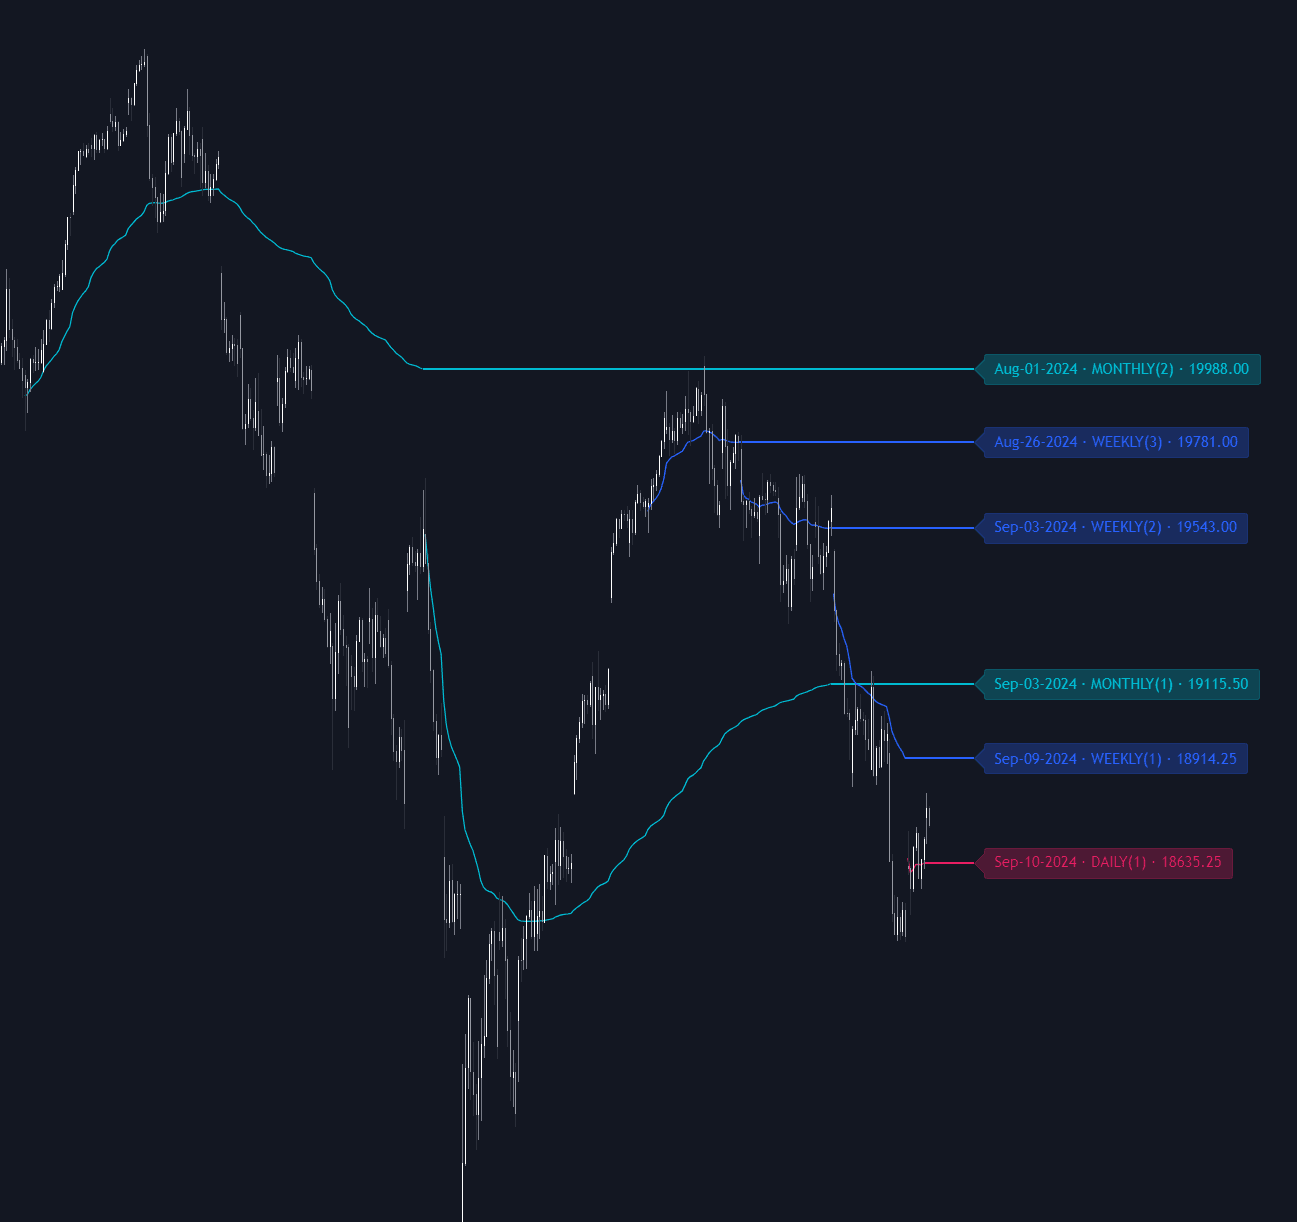
What are Periodic VWAPs?
Periodic VWAPs are volume-weighted average price lines anchored to the start of standard calendar periods: the week, month, quarter, or year. Each line begins at the period's first bar and accumulates from there, dividing the running sum of price times volume by the running sum of volume, then resets when the next period opens. The result is a family of curves, each tracking the average price actually paid across everything traded so far in that period: a weekly VWAP restarts at the week's first session, a monthly VWAP on the month's first trading day, and the quarterly and yearly lines at their own boundaries.
They matter because they extend the logic of the session VWAP to horizons that swing and position traders care about. A quarterly VWAP approximates the average entry of everyone who traded that quarter, so price holding above it says the period's average buyer is in profit, and returns to it are watched for a response. As the period matures, the volume behind a long-period VWAP becomes enormous, so the line moves slowly and gets treated as a higher-timeframe reference in the same spirit as prior period levels. Reactions there are common but never guaranteed; the level is context, not a signal.
Mechanically they are calendar-anchored special cases of the anchored VWAP: same arithmetic, with the anchor chosen by the calendar instead of by judgment. That standardization is the point, everyone's weekly VWAP starts at the same boundary, but the boundary itself depends on the chart: time zone, session template, and whether the week opens Sunday evening or Monday morning all shift the anchor bar, which is why the same line can differ slightly across platforms. Most implementations weight a typical price such as the bar's high-low-close average, another small source of cross-platform disagreement.
The line's behavior changes character across its life. In the first bars after a reset it rests on little volume and swings with every print; by period's end it carries so much accumulated weight that almost nothing moves it, and its final value becomes a natural static reference for the next period, which is exactly what LuxAlgo's VWAP Periodic Close plots. The institutional backdrop gives the levels real mechanics: VWAP is a standard execution benchmark, and monthly and quarterly flows are often worked against period averages, so the average-cost story is more than folklore, even if a chart line only approximates any desk's actual benchmark.
How to identify periodic VWAPs on a chart
Setup choices decide whether two charts even show the same lines, so identification starts with the anchors.
- 1Choose the periods to plot, weekly through yearly, and confirm each one's anchor boundary in your chart's time zone and session template.
- 2Check the price input, typically the high-low-close average per bar, since input choice shifts the line slightly.
- 3Treat the young line with suspicion: in the first sessions after a reset it rides on thin volume and jumps easily, so early crosses mean little.
- 4Mark where the prior period's VWAP finished as a static level; the handoff value often stays relevant into the new period.
- 5Read the stack: which periodic lines price is above or below, their slopes, and the distance to each, which together give the higher-timeframe context.
How it's calculated
Volume weighted average price recalculated from the start of each calendar period, giving that period's average traded price so far.
Each line resets at its anchor, so weekly, monthly, quarterly and yearly VWAPs run in parallel and the youngest line is the most volatile just after a reset.
hlc3 is the usual price source; some platforms offer close or hl2 instead.
Volume data quality drives the result, so the same instrument can print different VWAPs on different venues.
How traders use it
- As a higher-timeframe bias filter: price above a rising weekly or monthly VWAP keeps the period's average buyer in profit, so many traders only hunt longs in that state and treat a decisive loss of the line as a caution flag.
- As reference levels: the monthly, quarterly, and yearly lines are plotted as a slow-moving skeleton of support and resistance zones, and the first return to a long-untested periodic VWAP is watched for a bounce or a rejection, with no assumption it must hold.
- For stretch and reversion: distance from the active periodic VWAP, often framed with VWAP bands, flags when price is extended for that horizon, which reversion traders fade and trend traders use to time pullback entries instead of chasing.
- As a stack: alignment across periods, such as price above the weekly, monthly, and quarterly lines at once, works as a quick trend-health checklist, and losing them one by one maps a deteriorating trend.
- As handoff levels: the closing value of each completed period's VWAP is kept as a static line into the following period, marking where the previous period's average business was concluded and giving the new period an inherited reference to trade around.
Periodic VWAPs vs other VWAP variants
Session VWAP: Session VWAP resets every trading day and speaks to intraday auction context; periodic VWAPs apply the same arithmetic to weekly, monthly, quarterly, or yearly anchors for slower horizons.
Anchored VWAP: Anchored VWAP starts from a user-chosen event such as an earnings bar or a swing extreme; periodic VWAPs anchor automatically to calendar boundaries, trading flexibility for consistency.
Rolling VWAP: A rolling VWAP drags a fixed-length window forward and never resets, so it behaves like a moving average; periodic VWAPs have a hard anchor and expanding memory within each period.
Concept family
Volume & Order Flow
88 concepts mapped · 88 in the Library
Periodic VWAPs FAQ
Turn Periodic VWAPs into a trading strategy.
Take the implementation from this page into Quant, then build on it, backtest it on real data, and keep refining it in conversation.