Concept
Strength/weakness Background
Strength/weakness Background is a Volume & Order Flow concept. The Library holds 1 implementation, a working definition you can pull into Quant.
Top Strength/weakness Background indicator
The top custom implementation, built on the original standard Strength/weakness Background formula.
1 total
The Strength/weakness Background implementation below can become a backtested trading strategy — describe your rules and Quant writes the code.
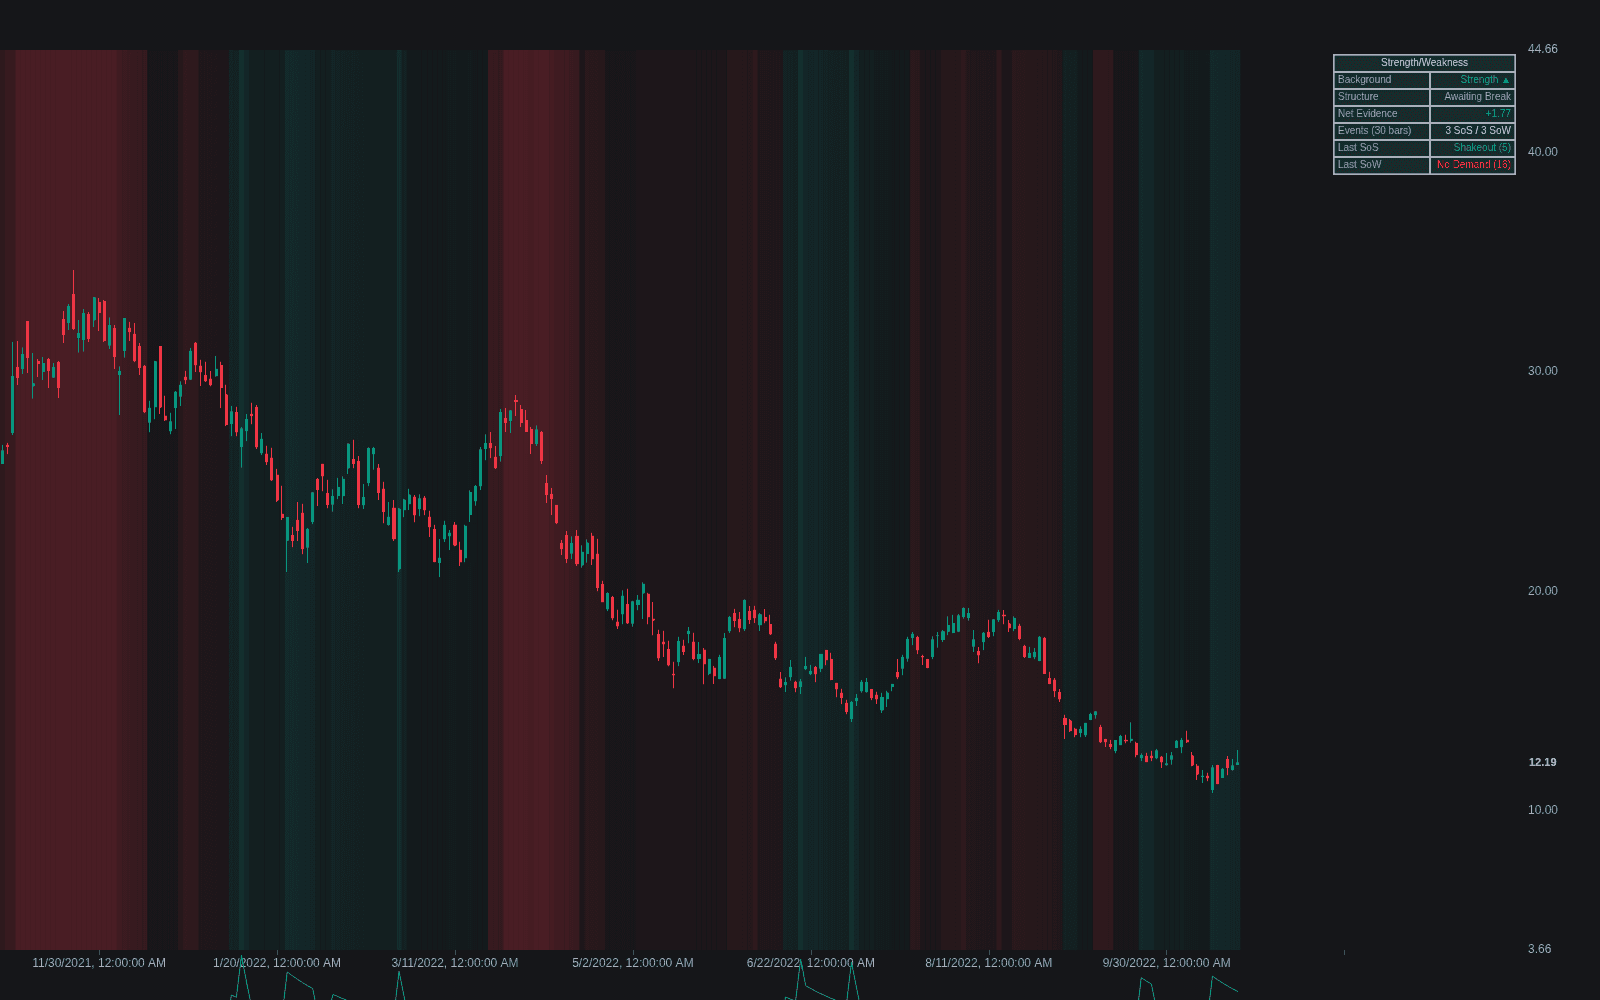
What is a strength/weakness background?
The strength/weakness background is a volume spread analysis (VSA) convention: instead of judging each bar in isolation, the analyst maintains a running verdict on whether recent action has printed more signs of strength or more signs of weakness, and many VSA indicators render that verdict as a shaded chart background (commonly green for accumulating strength, red for accumulating weakness). A sign of strength is an event that suggests professional buying, such as stopping volume, a successful test bar, or a shakeout that fails to find supply. A sign of weakness suggests professional selling, such as an upthrust, no-demand rallies, or heavy volume that produces no upward progress.
The idea exists because individual VSA bars are noisy. A single low-volume down bar means little on its own; a sequence of them, appearing after high-volume support and confirmed by tests, is a much stronger claim. The background aggregates those bar-level reads into a persistent context, so the trader asks not "what does this bar say?" but "what has the balance of evidence said over the recent stretch of bars?" This mirrors the parent framework's core logic of effort versus result: strength and weakness are inferred from how price responds to volume, not from price direction alone.
In practice the background works as a directional filter rather than a signal. A strength background biases the trader toward longs and toward treating dips as tests; a weakness background does the opposite. Because the aggregation rules differ between implementations (which events count, how they are weighted, how fast old evidence decays), two VSA tools can shade the same chart differently, so the background is best treated as a summary of a method, not an objective measurement.
How to read a strength/weakness background
Whether shaded by an indicator or tracked by hand, the background is built from the same sequence of observations.
- 1Locate the recent high-volume events: heavy volume on down bars near lows is candidate strength (potential absorption of supply), heavy volume on up bars near highs that fails to follow through is candidate weakness.
- 2Check the response bars: after candidate strength, look for low-volume tests holding above the lows; after candidate weakness, look for no demand rallies on shrinking volume.
- 3Weigh the evidence over a window of bars rather than reacting to the latest print; one contrary bar rarely flips the verdict.
- 4Treat a background flip as a regime change only when confirmed by structure, such as a failed retest or a break of the prior swing.
How traders use it
- As a trade filter: many VSA traders only take longs while the background shows strength and shorts while it shows weakness, using bar-level signals purely for timing.
- As context for tests: a low-volume test is trusted far more when it appears against a strength background, since the background implies supply was already absorbed.
- To avoid countertrend traps: a single bullish bar inside a persistent weakness background is often faded rather than followed.
- With honest limits: the background is derived, not observed. It inherits every misread of the underlying bars, lags at genuine turning points, and different implementations can disagree on the same data.
Strength/weakness background vs related VSA reads
No Demand / No Supply Bars: No demand and no supply are single-bar observations. The background is the running aggregate those observations feed into; one is evidence, the other is the verdict.
Effort vs Result: Effort versus result is the analytical principle used to classify each bar. The background is a bookkeeping layer on top of it, tracking which side the principle has favored recently.
Concept family
Volume & Order Flow
88 concepts mapped · 88 in the Library
Strength/weakness Background FAQ
Turn Strength/weakness Background into a trading strategy.
Take the implementation from this page into Quant, then build on it, backtest it on real data, and keep refining it in conversation.