Concept
Delta Profile
Delta Profile, also known as bid/ask profile, is a Volume & Order Flow concept. The Library holds 7 implementations, each one a working definition you can pull into Quant.
Top Delta Profile indicators
The top custom implementations, built on the original standard Delta Profile formula.
7 total
Any of the 7 Delta Profile implementations below can become a backtested trading strategy — describe your rules and Quant writes the code.
.png&w=3840&q=75)
What is a Delta Profile?
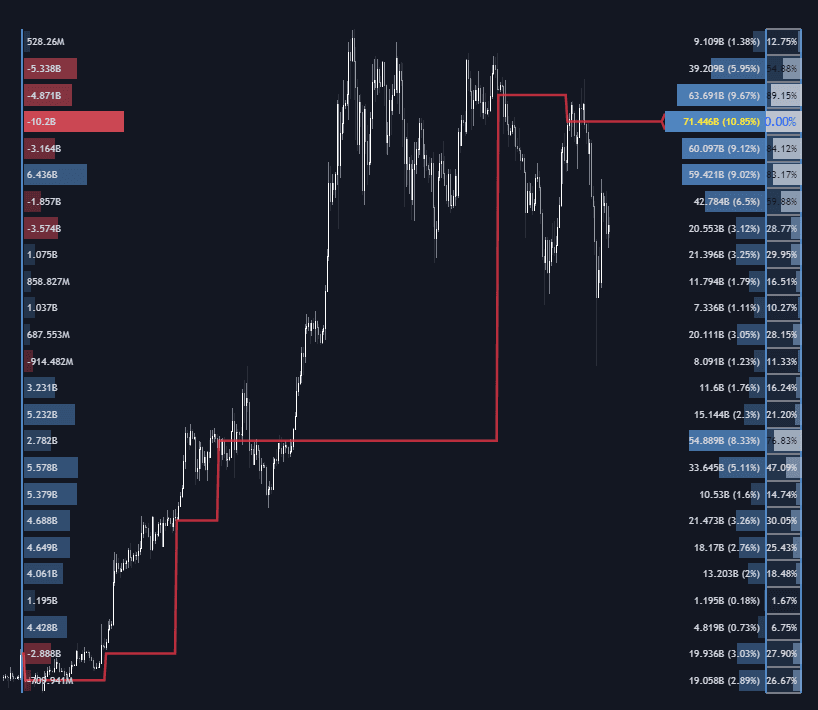
A delta profile is a price-by-price histogram of net aggression. For every price level in a chosen window (a session, a swing, the visible range), it accumulates volume delta: volume executed at the ask minus volume executed at the bid. Each row therefore shows whether market buyers or market sellers were the initiators at that price. Where a volume profile answers how much traded at a level, the delta profile answers who was pressing at it: positive rows mark levels attacked by buyers, negative rows mark levels attacked by sellers. Some platforms label the same construction a bid/ask delta profile, while others display bid and ask volume separately at each price rather than the net.
The tool's lineage runs through the futures order-flow platforms of the 2000s, where footprint-style displays first split each bar's volume into trades hitting the bid versus lifting the ask. A delta profile reorganizes that data by price instead of by bar, borrowing the histogram format of volume profiling. Implementations vary: rows can show net delta, separate bid and ask columns, or delta filtered to large trades only, and some mark the rows of maximum positive and negative delta the way a point of control marks maximum volume.
Interpretation runs through what price did next. Strong positive delta at a level that launched higher reads as initiative buying; equally strong positive delta at a level where price stalled reads as buyers being absorbed by passive sellers, which is often the more useful finding. Two caveats keep the tool honest. Delta needs trade data with bid/ask attribution, so platforms without tick data estimate it, and different feeds produce visibly different profiles. And the profile is descriptive of what already happened; nothing obliges the same participants to defend a level on the revisit.
In practice the delta profile earns its place as the disambiguator of the profile family. Volume alone cannot distinguish a level buyers forced their way through from one where they were met and stopped, and that distinction changes what a retest should mean. Read against session VWAP or the value area, a delta skew also says who was in control above or below fair value. It remains a secondary tool: levels and structure come first, and delta explains them rather than replaces them.
How to Read a Delta Profile
Platforms render it as a sideways histogram beside price; the reading sequence is consistent:
- 1Anchor the window deliberately: a session for day trading, a swing anchor for a specific leg, or the visible range for quick reconnaissance; the story changes with the window.
- 2Locate the extreme rows, the largest positive and largest negative delta prices; extremes at the edges of the range carry more information than extremes mid-range.
- 3Compare each extreme row with what price did there: aggression followed by displacement reads as initiative, aggression at a level that held reads as absorption.
- 4Cross-check total volume at the same rows; heavy delta inside a thick high-volume shelf means something different from heavy delta at a thinly traded price.
- 5Mark the standout rows as zones a few ticks wide, wider when the feed estimates delta, and judge any revisit by the fresh flow it brings, not the old print.
How it's calculated
Shows, for each price level in the profile window, the net difference between volume traded by aggressive buyers and volume traded by aggressive sellers.
Positive Delta_p marks levels where market buying dominated, negative where market selling dominated.
Exact classification needs bid/ask tick data; without it platforms approximate with the tick rule or by signing intrabar volume with candle direction.
Bin height and window choice (per session, fixed range, or per bar) are user settings and change the profile.
How traders use it
- To locate defended levels: rows where one side's aggression repeatedly failed to move price flag likely resting interest, giving order-flow evidence for a support or resistance zone beyond a simple touch count.
- To spot absorption at extremes: heavy negative delta concentrated at lows that refuse to break suggests sellers are being soaked up, a common precondition in reversal playbooks, with the mirror case at highs.
- In confluence with the standard profile: a busy level whose delta is heavily skewed tells you which side built it, refining how high- and low-volume nodes are traded on a retest.
- To qualify breakouts: delta concentrated beyond the breakout row shows whether initiative flow drove the move, complementing volume-at-breakout checks.
- For post-trade review: seeing where delta concentrated during a move shows whether entries were with or against the dominant aggressor, which candles alone rarely reveal.
Delta Profile vs related concepts
Volume Profile: Same histogram format, different quantity: total volume versus signed buy-minus-sell volume. A level can be enormous on the volume profile and nearly flat on the delta profile if trade there was evenly two-sided.
Volume Delta: The raw ingredient, usually shown per bar or accumulated over time. The delta profile redistributes it over price, so the two answer different questions: when aggression shifted versus where it was spent.
TPO Profile: Builds its histogram from time spent at each price, with no volume and no side attribution at all. TPO shows where the market dwelled; the delta profile shows who was attacking while it dwelled.
More Delta Profile implementations
Concept family
Volume & Order Flow
88 concepts mapped · 88 in the Library
Delta Profile FAQ
Turn Delta Profile into a trading strategy.
Take any implementation from this page into Quant, then build on it, backtest it on real data, and keep refining it in conversation.