Concept
DOM
DOM, also known as depth of market, is a Volume & Order Flow concept. The Library holds 2 implementations, each one a working definition you can pull into Quant.
Top DOM indicators
The top custom implementations, built on the original standard DOM formula.
2 total
Want to trade DOM? Any of the 2 implementations below is one prompt away from a backtested strategy in Quant.
%202.png&w=3840&q=75)
What is the DOM?
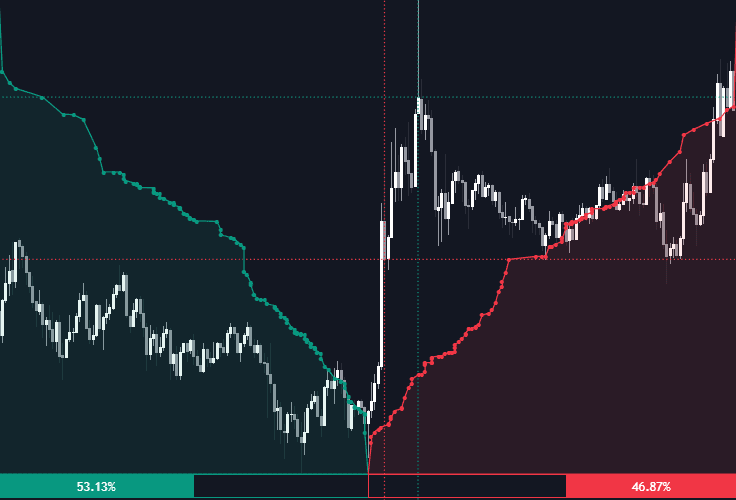
The DOM (depth of market) is the live order book displayed as a price ladder: the size of resting limit orders at each level on the bid side and the ask side, often ten or so levels each way depending on the feed. It shows intentions rather than transactions; every number on the ladder is liquidity someone has offered at that price and can cancel at any moment. Futures scalpers read the DOM to judge where liquidity is thick or thin and how fast it is being consumed or reloaded.
The ladder is the electronic descendant of the pit: when futures migrated to screens around the turn of the millennium, the price ladder became the scalper's primary instrument, and a whole trading culture (ladder software, one-click execution, queue tactics) grew around reading it. The display itself is simple, bids stacked below the market, asks above, sizes updating tick by tick; everything difficult about the DOM is in the behavior, not the layout.
Because resting orders can be layered, spoofed, or pulled, the DOM is read together with executions: the tape shows what actually traded, and footprint charts aggregate those executions bar by bar. Large size that persists and absorbs incoming orders as price approaches is more informative than size that vanishes on contact, which is what liquidity heatmaps are built to track over time.
The craft reads are behavioral. Absorption is the constructive tell: a level whose size holds and refills while market orders hit it, business actually transacting into the wall. Pulling is its opposite, displayed size cancelling as price approaches, and reloading (the same size reappearing after partial fills, the iceberg signature) sits between them. Venue matters as much as behavior, since equity depth fragments across exchanges, crypto books differ per venue, and centralized futures books remain the cleanest habitat for ladder reading.
How to read a DOM ladder
The ladder's numbers are cheap to display and expensive to interpret; the reading is behavior over snapshots.
- 1Orient the ladder: resting bids stacked below the last price, resting asks above, with the inside market at the center.
- 2Scan for outsized levels: resting size that dwarfs neighboring levels marks the prices other participants have committed to visibly.
- 3Watch approach behavior: size that absorbs incoming market orders and holds is defense; size that cancels as price nears was decoration.
- 4Track reload speed: levels that refill after being consumed (iceberg behavior) show commitment beyond the displayed number.
- 5Cross-check against executions: the tape and volume delta confirm whether the aggression the ladder implies is actually transacting.
- 6Discount the theater: layering and spoofing paint depth with no intent to trade, which is why displayed size is evidence, never proof.
How traders use it
- Locating thick liquidity: unusually large resting size often acts as a short-term barrier or magnet, and traders watch whether it absorbs incoming market orders or gets pulled as price nears.
- Timing entries at a level: rather than buying a level blind, DOM traders wait to see bids refresh and hold under pressure before joining, and stand aside when the ladder thins out.
- Gauging pace and urgency: the speed at which levels are consumed and reloaded shows how hard one side is pressing; a ladder being eaten level by level is the microstructure view of a sweep.
- Managing queue position: limit-order traders join behind visible size to inherit its protection and gauge fill odds from how much of the queue stands ahead, ladder mechanics invisible to chart-level analysis.
- Pairing intentions with history: the ladder shows where liquidity waits now, while a volume profile shows where business concentrated before, and confluence between a thick level and a high-volume node marks prices doubly defended.
DOM vs neighboring order-flow views
Volume Profile: The profile is history: volume that actually transacted at each price over a window. The DOM is intention: orders resting now, cancellable at will. One cannot be spoofed and cannot see forward; the other sees the queue and can be theater.
Volume Delta: Delta measures executed aggression, who crossed the spread, while the DOM shows the passive side waiting to be hit. Read together they complete the auction: the ladder proposes, the delta disposes, and absorption is precisely heavy delta against unmoving depth.
Concept family
Volume & Order Flow
88 concepts mapped · 88 in the Library
DOM FAQ
Turn DOM into a trading strategy.
Take any implementation from this page into Quant, then build on it, backtest it on real data, and keep refining it in conversation.