Concept
Weis Wave Volume
Weis Wave Volume is a Volume & Order Flow concept. The Library holds 2 implementations, each one a working definition you can pull into Quant.
Top Weis Wave Volume indicators
The top custom implementations, built on the original standard Weis Wave Volume formula.
2 total
Every Weis Wave Volume implementation here is strategy-ready: open one in Quant, set your rules, and it backtests automatically.
.png&w=3840&q=75)
What is Weis Wave Volume?
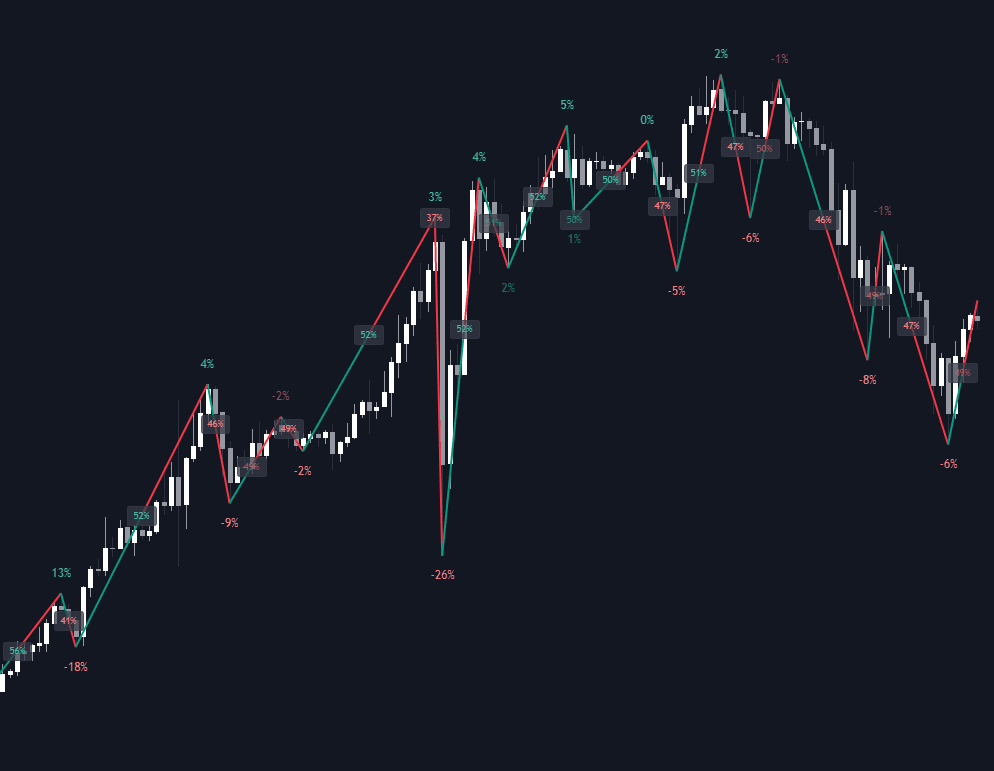
Weis Wave Volume is a Wyckoff-lineage tool developed by David Weis that organizes volume by swing instead of by bar. Price is first segmented into alternating up and down waves using a reversal rule, essentially a zigzag: a wave stays alive until price retraces by a chosen amount. The volume of every bar inside a wave is then summed and plotted as a single histogram column, colored by wave direction. Instead of asking how much traded in one bar, it asks how much effort went into the entire swing.
The read is Wyckoff's effort versus result applied wave by wave, a modern descendant of the wave charts Wyckoff himself kept. Growing volume on up-waves that make good progress supports an advance; a heavy wave that travels a short distance suggests the move is being absorbed; shrinking volume on pushes to new extremes suggests the drive is tiring. The tool frames those comparisons cleanly, but the conclusions still depend on context and are not mechanical signals.
Weis, a longtime Wyckoff educator, laid the method out in his book Trades About to Happen, and popular implementations by LazyBear and modhelius carried it onto modern charting platforms. The reversal rule is the only real parameter, and it can be defined in points, percent, or volatility units; every choice redraws the waves, which is why two users of the same tool can see different columns on the same chart. Refinements swap what gets summed: LuxAlgo's Delta ZigZag accumulates volume delta per swing instead of total volume, splitting each wave's effort into the aggression of buyers versus sellers rather than raw participation.
The structural caveats are the honest part. The current wave is open by construction: its column keeps growing until the reversal rule confirms the swing ended, so the newest reading is always provisional, and a threshold change rewrites history. Comparisons are relative, not absolute: a heavy wave means heavy against neighboring waves on the same settings, nothing more. And the volume feed sets the ceiling: on instruments reporting tick counts rather than traded size, wave columns measure activity, not business done, and the Wyckoff vocabulary of effort should be read accordingly.
How to identify Weis Wave signals on charts
The tool plots one histogram column per completed swing. Reading it is a comparison exercise: each wave against the waves around it.
- 1Set the reversal threshold so the resulting waves match the swings you actually trade: too small produces noise waves, too large merges distinct swings into one column.
- 2Confirm the zigzag segmentation visually: each column should correspond to a price swing you would recognize without the indicator.
- 3Compare consecutive same-direction waves: rising columns on successive up-waves show effort building behind the advance, shrinking columns show it draining.
- 4Set effort against result: a tall column whose wave covered little ground flags absorption, most meaningful when it happens into an obvious level rather than in open space.
- 5Qualify breakouts by wave, not bar: a range break backed by a column clearly exceeding recent waves shows participation, the swing-level version of checking volume at breakout.
How traders use it
- To compare effort across alternating swings: if down-waves carry progressively less volume than the up-waves they interrupt, sellers are read as losing interest, and the reverse for buyers.
- To spot absorption at range extremes: a large-volume wave into support or resistance that produces little price progress is treated as a sign the aggressive side is being met by passive orders.
- To qualify breakouts: a breakout wave whose cumulative volume clearly exceeds recent waves shows participation, while a breakout on a thin wave invites suspicion of a failed move.
- As a swing-level divergence read: successive pushes to new price extremes on shrinking wave columns, the wave-sized cousin of volume divergence, warn that the drive is running out of participants.
- In delta-refined form: summing signed aggression per swing, as LuxAlgo's Delta ZigZag does, shows which side initiated the business inside each wave, sharpening the absorption read when heavy columns and small progress coincide.
Weis Wave Volume vs other volume lenses
Volume Profile: The profile organizes volume by price level, showing where business accumulated; Weis Wave organizes it by swing, showing when effort was spent. One maps acceptance, the other maps the force behind each push; they answer different questions and combine well.
Volume Delta: Delta splits volume by aggressor side per bar, demanding tick data. Weis Wave sums total volume per swing from any OHLCV feed. Delta is finer-grained about who initiated; Weis Wave is coarser but readable at swing scale, and hybrid tools sum delta per wave.
Volume Spike: A spike is a single-bar anomaly, easy to see and easy to overweight. A Weis wave aggregates the whole swing, so one loud bar inside an otherwise thin push no longer dominates the read. The wave view trades immediacy for a fairer measure of sustained effort.
Concept family
Volume & Order Flow
88 concepts mapped · 88 in the Library
Weis Wave Volume FAQ
Turn Weis Wave Volume into a trading strategy.
Take any implementation from this page into Quant, then build on it, backtest it on real data, and keep refining it in conversation.