Concept
Center of Gravity
Center of Gravity is a Momentum & Oscillators concept. The Library holds 1 implementation, a working definition you can pull into Quant.
Ehlers
Top Center of Gravity indicator
The top custom implementation, built on the original standard Center of Gravity formula.
1 total
The Center of Gravity implementation below can become a backtested trading strategy — describe your rules and Quant writes the code.
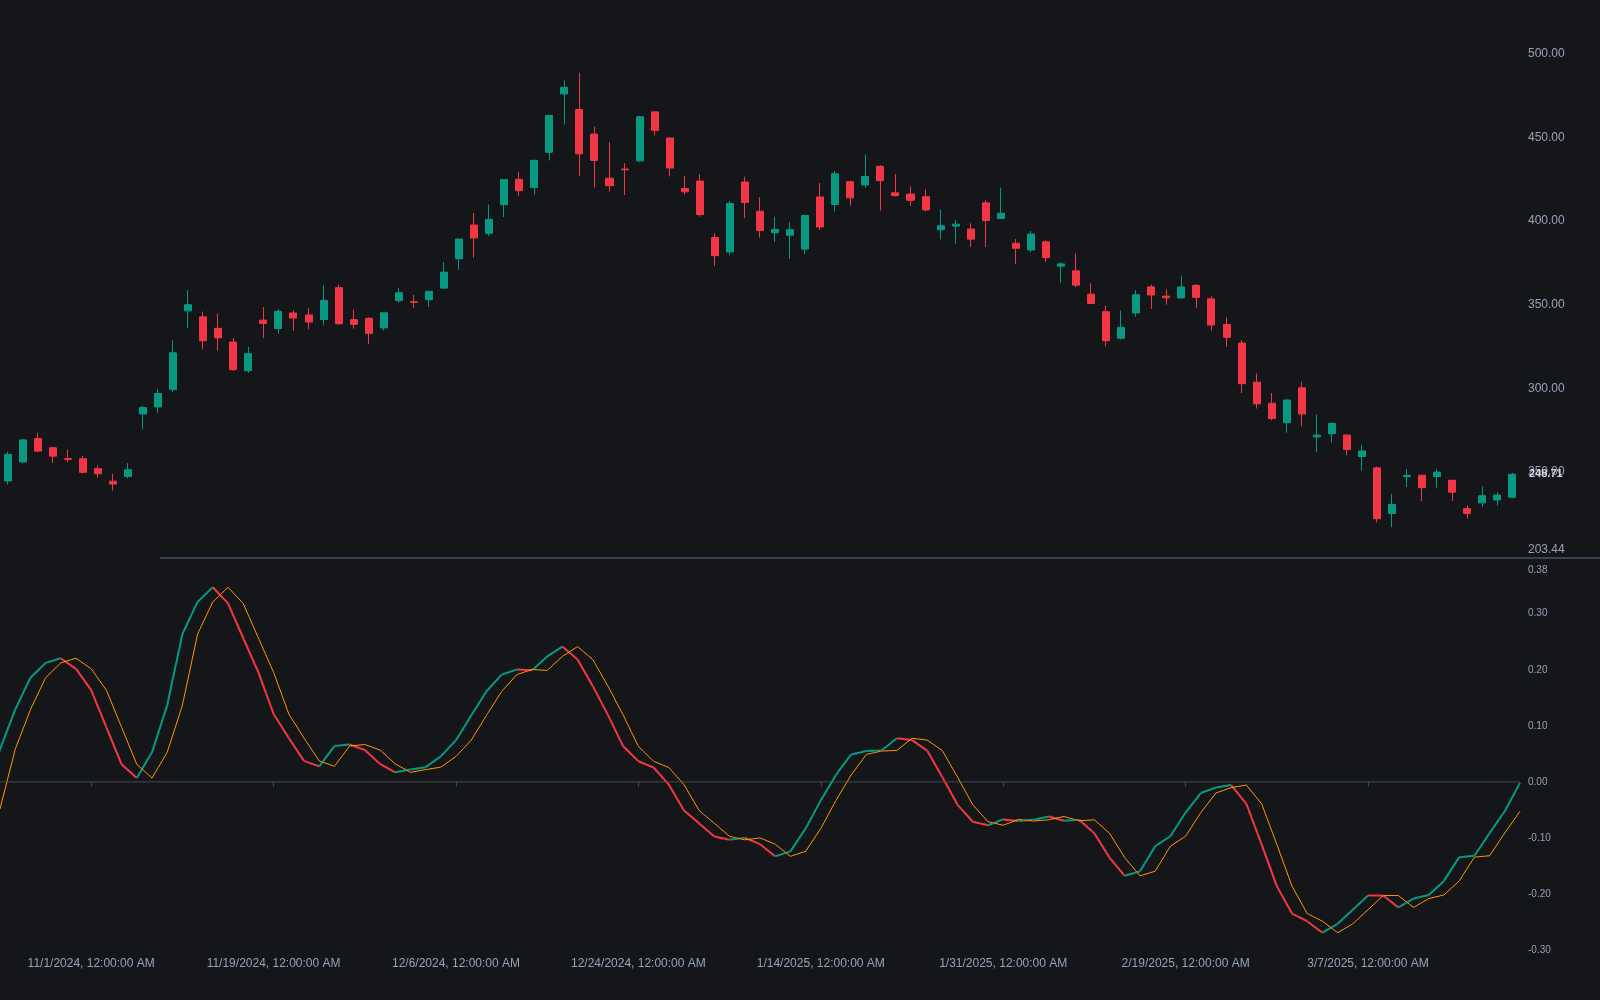
What is the Center of Gravity?
The Center of Gravity is John Ehlers's oscillator, published in 2002, that locates the balance point of recent prices. Over a fixed window it weights each bar's price by its position, counting the newest bar as one and the oldest as the window length, divides the sum of the weighted prices by the sum of the prices, and negates the result: the centroid of the window, expressed in bar positions. When rising prices load the front of the window, the centroid shifts toward the newest bars and the line turns up; when the oldest bars carry the weight, it turns down.
Because the output is the centroid of a finite window, a relative of windowed FIR smoothing, Ehlers argued it smooths price without the usual lag penalty, and the standard plot pairs the line with a one-bar-delayed copy of itself as a trigger. Two cautions: it is a cycle tool that pins to one side during persistent trends, and the same name is also used for an unrelated polynomial-regression channel drawn around price. This page covers the Ehlers oscillator.
Ehlers, an engineer who spent his career applying signal processing to markets, introduced the CG oscillator in the May 2002 issue of Technical Analysis of Stocks & Commodities and developed it further in his 2004 book Cybernetic Analysis for Stocks and Futures. His starting point was the standard filter tradeoff: conventional moving averages buy smoothness with lag. Because the centroid falls out of the window summation itself rather than an extra smoothing stage, he presented the CG as smoothed yet essentially lag-free, so cycle turns can be acted on early.
The CG is a cycle-timing specialist. Unlike raw momentum, which differences prices, or fixed-scale tools like RSI that support absolute overbought/oversold rules, the CG has no fixed bounds, so its extremes are judged against its own recent swings. That is why Ehlers later added a stochastic-normalized variant, and why ports of both versions remain common on charting platforms.
How to identify Center of Gravity signals on a chart
The CG plots in its own panel as two lines: the oscillator and a one-bar-delayed copy that serves as the trigger.
- 1Establish the regime first from price structure or a trend filter; CG crossings are meant to be traded while price is ranging, not trending.
- 2Mark crossings of the oscillator and trigger: an upward cross near the bottom of the indicator's recent envelope is a cycle-trough cue, a downward cross near the top a crest cue.
- 3Check for pinning: if the line hugs one side and crossings stop alternating cleanly, a trend has taken over and counter-trend signals should be stood down.
- 4Confirm turns against chart levels; a trough cross at range support is a materially different trade from one in mid-air.
How traders use it
- For swing-turn timing in ranges: crossings of the oscillator and its delayed trigger line mark cycle turns with little lag while price is oscillating rather than trending.
- Through the stochastic variant, which applies stochastic-style normalization to the centroid over a lookback so cycle extremes register at consistent levels.
- Gated by a regime filter: since trends keep the centroid displaced in one direction, most workflows suppress its counter-trend signals once a trend regime is detected.
- For divergence reads: price making a higher high while the CG makes a lower high is a regular bearish divergence-style warning that the cycle's upswings are weakening.
Center of Gravity vs other oscillators
Stochastic Oscillator: The stochastic locates the close within the high-low range of the lookback and is bounded 0 to 100, feeding fixed overbought and oversold rules. The CG locates the balance point of prices within the window and is unbounded, so extremes are relative. Both aim at swing timing; the CG trades fixed thresholds for smoother turns.
RSI: RSI compares average gains against average losses and doubles as a regime gauge through its 50 line and shifted ranges. The CG carries no such level semantics; it is purely a turn-timing tool, typically smoother than RSI at comparable lengths but silent about trend strength.
CCI: CCI measures price's deviation from a moving average scaled by mean deviation and is likewise unbounded. The difference is what moves them: CCI stretches when price departs from its average, while the CG shifts when the distribution of recent prices tilts toward the newest or oldest bars.
Concept family
Momentum & Oscillators
91 concepts mapped · 91 in the Library
Center of Gravity FAQ
Turn Center of Gravity into a trading strategy.
Take the implementation from this page into Quant, then build on it, backtest it on real data, and keep refining it in conversation.