Concept
Accumulative Swing Index
Accumulative Swing Index, also known as ASI, accumulation swing index, is a Momentum & Oscillators concept. The Library holds 1 implementation, a working definition you can pull into Quant.
Top Accumulative Swing Index indicator
The top custom implementation, built on the original standard Accumulative Swing Index formula.
1 total
From studying Accumulative Swing Index to trading it: take the implementation below into Quant and backtest it instantly.
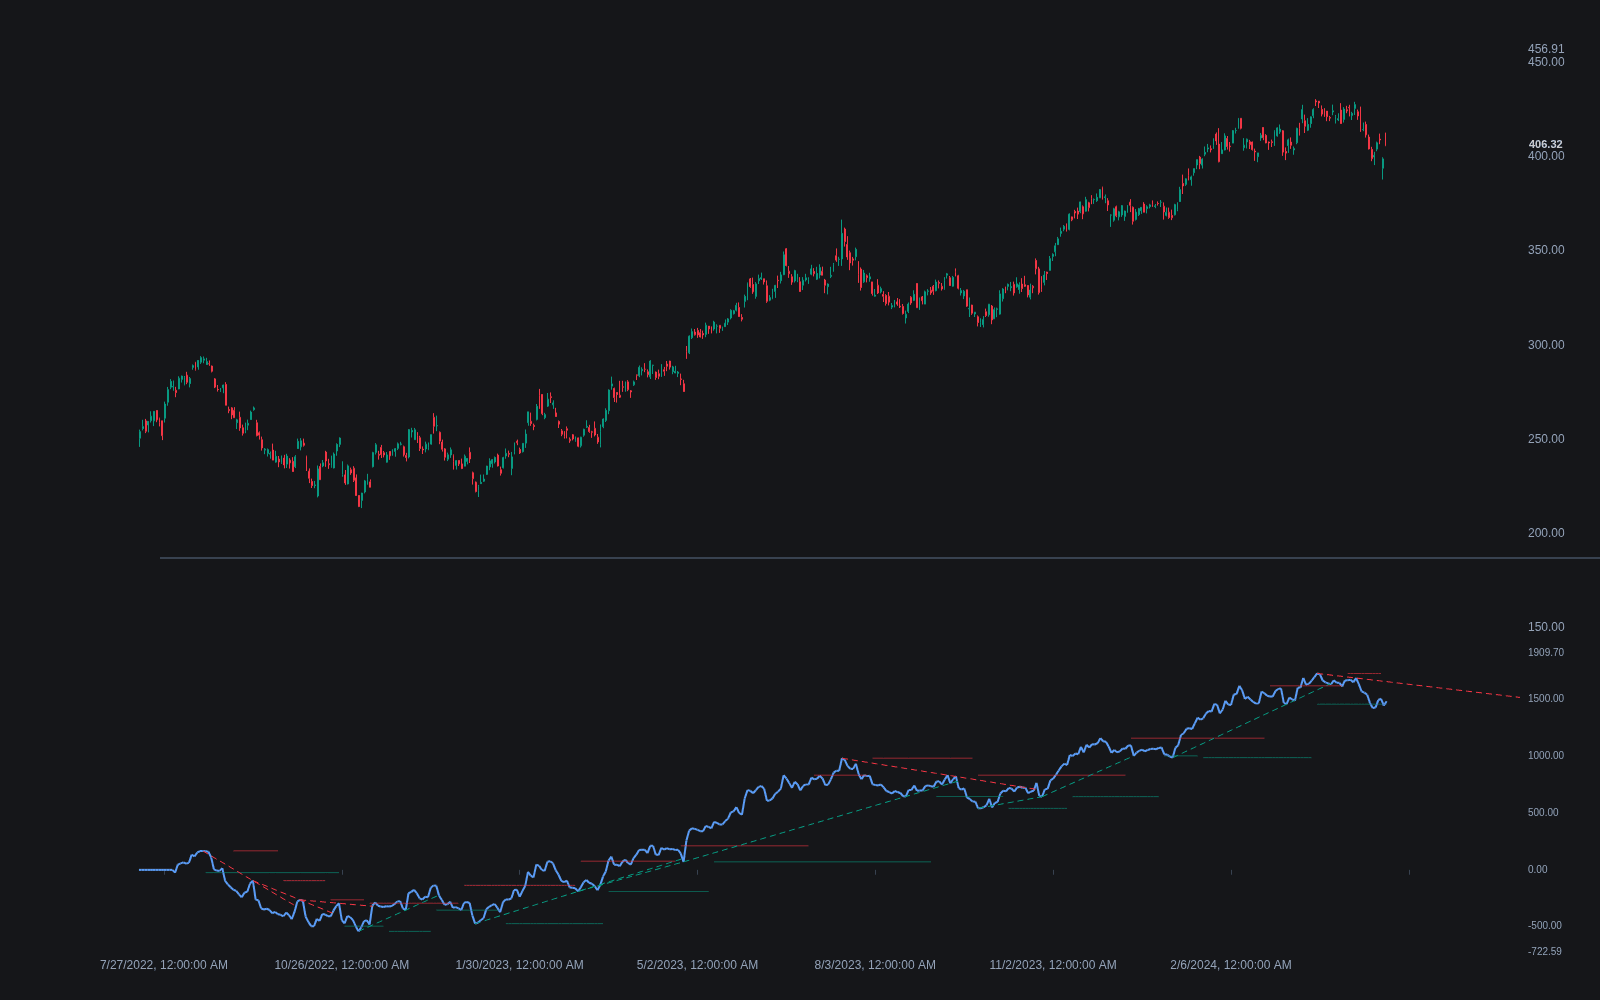
What is the Accumulative Swing Index?
The Accumulative Swing Index (ASI), also written as the accumulation swing index and abbreviated ASI, is a running total of J. Welles Wilder's Swing Index, published in his 1978 book New Concepts in Technical Trading Systems. The Swing Index condenses each bar's open, high, low, and close, together with the prior bar's, into a single signed number meant to capture the bar's real directional force. The ASI simply accumulates those numbers, producing a line that Wilder described as a distilled version of price itself.
Wilder's motivation was that raw OHLC bars contain conflicting information: a bar can close higher yet show heavy rejection at its high, or gap against the prevailing move. By weighting the relationships among the two bars' opens, closes, and extremes, the Swing Index tries to score what the bar actually accomplished, and the accumulated line makes the market's cumulative accomplishment visible.
The practical payoff is that trendlines, support breaks, and swing points drawn on the ASI often mirror those on price, and Wilder argued that a breakout on the ASI validates a breakout on the price chart. It was designed for futures, where the formula's limit-move divisor originally came from exchange price limits.
How it's calculated
Each bar's Swing Index is computed from the current and prior bar's OHLC, then accumulated.
R has three cases in Wilder's original text; most platforms implement them verbatim.
In markets without price limits, T is commonly replaced by a large constant or a volatility-based value, which changes the scale but not the shape of the line.
How traders use it
- As breakout confirmation: a price breakout accompanied by the ASI exceeding its own prior swing high (or low) is treated as validated, while a price breakout the ASI does not confirm is suspect. This was Wilder's primary published use.
- As a trendline instrument: trendlines drawn on the ASI frequently break a bar or two before the equivalent line on price, so some traders use ASI line breaks as an early exit or entry trigger.
- As a divergence gauge: price making a new extreme while the ASI fails to is read as fading directional force, similar to divergence on volume-based lines like OBV.
- Its limitations are scale and dependency: the raw value depends on the limit-move divisor, making cross-market comparison meaningless, and because it needs valid opens it degrades on data where the open is synthetic. It is a confirmation tool, not a standalone system.
ASI vs related cumulative and swing measures
Swing Index: The Swing Index is the per-bar building block, oscillating around zero and noisy on its own. The ASI is its running total, which converts bar-level readings into a trending line suitable for trendlines and breakout analysis.
Williams A/D: Williams' accumulation/distribution also builds a cumulative line from bar relationships, but from a simpler true-range-based buying/selling pressure measure. The ASI uses Wilder's heavier OHLC weighting scheme and a limit-move normalization.
OBV: OBV accumulates volume signed by the close-to-close direction, so it needs volume data and ignores intrabar structure. The ASI is price-only and extracts its signal from the geometry of consecutive bars.
Concept family
Momentum & Oscillators
91 concepts mapped · 91 in the Library
Accumulative Swing Index FAQ
Turn Accumulative Swing Index into a trading strategy.
Take the implementation from this page into Quant, then build on it, backtest it on real data, and keep refining it in conversation.