Concept
Hidden Divergence
Hidden Divergence is a Momentum & Oscillators concept. The Library holds 1 implementation, a working definition you can pull into Quant.
Top Hidden Divergence indicator
The top custom implementation, built on the original standard Hidden Divergence formula.
1 total
From studying Hidden Divergence to trading it: take the implementation below into Quant and backtest it instantly.
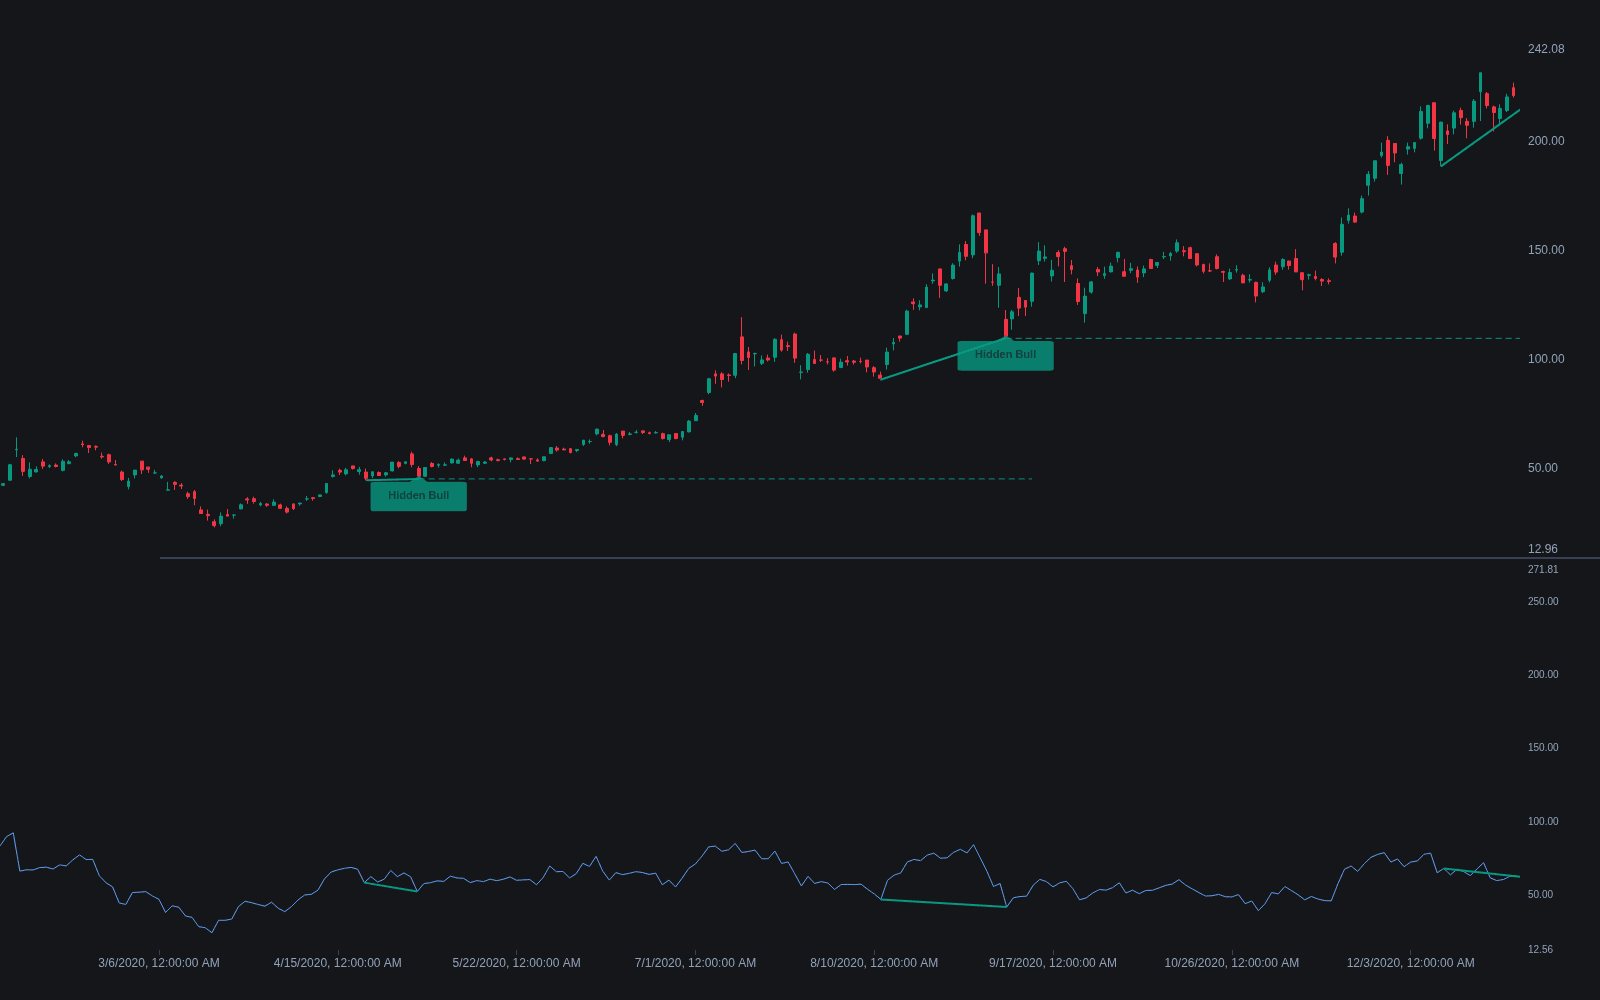
What is Hidden Divergence?
Hidden divergence is a swing-to-swing disagreement between price and an oscillator in which the oscillator, not price, makes the more extreme print. In an uptrend, price sets a higher low while RSI or another momentum gauge sets a lower low: hidden bullish divergence. In a downtrend, price sets a lower high while the oscillator sets a higher high: hidden bearish divergence. Where regular divergence warns of a possible reversal, hidden divergence argues for continuation.
The logic is a momentum reset inside intact structure. The pullback was sharp enough to drive the oscillator below its prior swing low, yet price still defended a higher low, so the trend absorbed the counter-pressure without breaking. Because the signal points with the prevailing trend, it is treated as a continuation setup. Some sources call it reverse or continuation divergence; the geometry is agreed on, while preferred oscillators and swing definitions vary by author.
It matters because it completes the divergence grammar: regular divergence hunts turns, hidden divergence times pullback entries, and confusing the two produces countertrend trades at the worst spots. Its failure modes are equally predictable: without an established trend there is nothing to continue, and swing points only exist once confirmed, so the pattern counts only after both pivots are fixed.
How to identify hidden divergence
The pattern is defined on confirmed swing points, compared like-for-like between price and the oscillator.
- 1Establish the trend first, from structure (higher highs and higher lows, or their inverse) or a higher-timeframe trend filter. Hidden divergence is only defined when there is a trend to continue.
- 2Mark two consecutive confirmed swing lows in an uptrend (swing highs in a downtrend) on price, and read the oscillator's values at those same swings.
- 3Check the geometry: hidden bullish needs a higher low in price against a lower low on the oscillator; hidden bearish needs a lower high in price against a higher high on the oscillator.
- 4Act only after the second pivot confirms. A swing high/low is confirmed only once a set number of bars have printed on each side of it without exceeding it, and divergence lines drawn to unconfirmed pivots repaint.
How traders use it
- As a pullback-entry timer: in an uptrend, hidden bullish divergence printing as price retraces into support argues the correction is ending, often stacked with a fib retracement or moving-average zone for confluence.
- As a trend-alignment filter: divergence detectors typically fire both types, and taking only the hidden signals that point with the higher-timeframe trend screens out countertrend temptation.
- As a structure anchor: pairing the oscillator geometry with the actual higher low gives the trade a falsifiable premise, since the continuation idea is wrong if that low breaks.
- As one input in divergence scoring: alongside regular divergence and volume divergence, hidden divergence contributes to composite evidence rather than acting as a standalone trigger.
Hidden Divergence vs other divergences
Regular Bullish/bearish Divergence: In regular divergence price makes the more extreme swing (a new high or low) that the oscillator refuses to confirm, arguing for reversal. Hidden divergence mirrors it: the oscillator makes the extreme, price does not, and the argument is continuation.
Divergence Variants & Confirmation: That page covers the taxonomy around both types: strength classes, multi-swing variants, and the confirmation rules (pivot completion, trigger conditions) that determine when any divergence is treated as tradeable.
Smart Money Technique Divergence: SMT divergence compares two correlated instruments, where one makes a new extreme and the other refuses, rather than comparing price against an oscillator. Same word, different axis of comparison.
Volume Divergence: Volume divergence compares price swings against volume or a volume-derived line, asking whether participation confirms the move. Hidden divergence is strictly a momentum-versus-price geometry with a continuation read.
Concept family
Momentum & Oscillators
91 concepts mapped · 91 in the Library
Hidden Divergence FAQ
Turn Hidden Divergence into a trading strategy.
Take the implementation from this page into Quant, then build on it, backtest it on real data, and keep refining it in conversation.