Concept
TD Sequential
TD Sequential, also known as Setup 9 / Countdown 13, setup perfection, TDST levels, aggressive variant, is a Momentum & Oscillators concept. The Library holds 2 implementations, each one a working definition you can pull into Quant.
Top TD Sequential indicators
The top custom implementations, built on the original standard TD Sequential formula.
2 total
Any of the 2 TD Sequential implementations below can become a backtested trading strategy — describe your rules and Quant writes the code.
.png&w=3840&q=75)
What is TD Sequential?
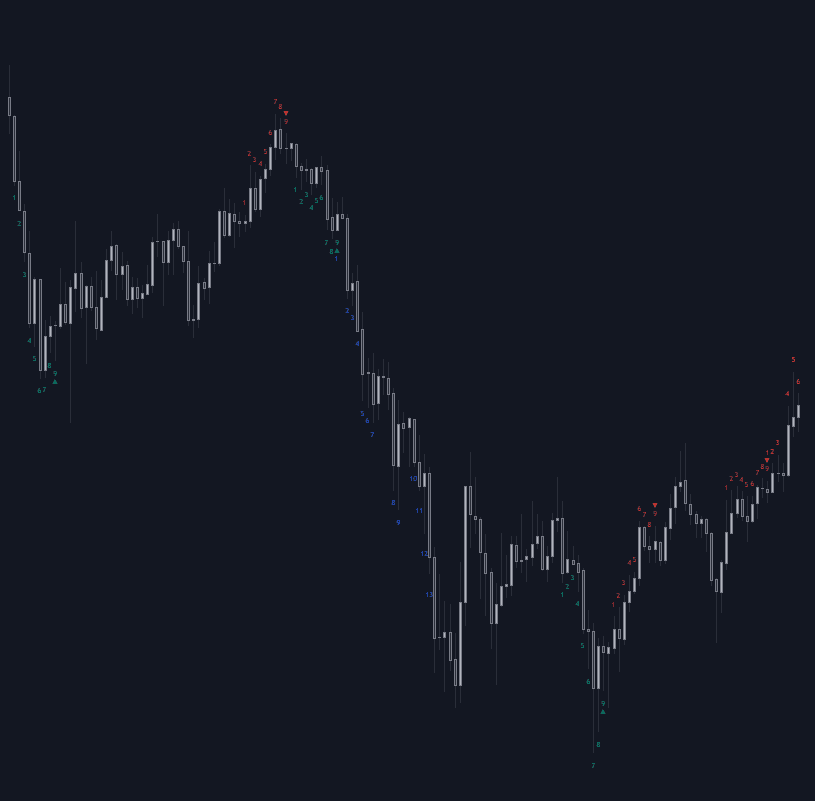
TD Sequential is Tom DeMark's exhaustion-counting framework, built from two counts. Setup counts nine consecutive closes, each lower than the close four bars earlier for a buy setup (higher for a sell). Countdown then tallies thirteen qualifying closes, each at or below the low two bars earlier for a buy (at or above the high for a sell), and countdown bars need not be consecutive. Completed counts flag a trend that may be running out of fuel, not one that has already reversed.
DeMark built his counting studies through decades of consulting for institutional desks and published the framework's logic in his 1990s books, from which the licensed TD indicator suite spread across professional platforms. The design premise is distinctive: instead of measuring magnitude the way oscillators do, Sequential counts bar relationships, asking how long a move has kept beating its own recent past, and treats the ability to keep doing so as the thing that exhausts.
The framework carries its own refinements. A setup is 'perfected' when bar eight or nine trades beyond the extremes of bars six and seven. The extreme end of a completed setup (in DeMark's definition, the true high or low of the setup's first bar) projects a TDST level that behaves as support or resistance; holding or breaking it is DeMark's test of whether the trend deserves to continue. An aggressive variant qualifies countdown bars on highs and lows instead of closes.
Practice adds the discipline the counts alone lack. Completed nines and thirteens are conventionally traded only with a price flip (a close reversing the count's own four-bar relationship) or another confirmation, since persistent trends print completion after completion while running; counts can recycle when a new setup begins before countdown finishes; and the signals pair naturally with independent exhaustion evidence such as momentum divergence or stretched overbought/oversold readings from a differently built tool.
How to identify TD Sequential counts on a chart
The buy-side (bottom-finding) counts are described; mirror every comparison for the sell side.
- 1Count the setup: nine consecutive closes, each below the close four bars earlier; any break in the streak resets the count.
- 2Check perfection: the low of bar eight or nine trading at or below the lows of bars six and seven upgrades the setup.
- 3Begin countdown after a completed setup: tally closes at or below the low two bars earlier until thirteen print; the bars need not be consecutive.
- 4Mark the TDST level from the setup's origin (the true high of a buy setup's first bar) as the continuation-versus-reversal reference.
- 5Wait for confirmation before acting: the conventional trigger is a price flip, a close back above the close four bars earlier.
- 6Respect the framework's cancellations: a fresh opposing setup or a decisive TDST break says the count's story is over.
How traders use it
- To anticipate trend exhaustion: completed 9s and 13s mark places where a persistent move is vulnerable, usually traded with a confirming price flip rather than blind.
- As objective levels: TDST lines drawn from setup extremes give a rule-based read on continuation versus reversal when price returns to them.
- As a filter on other signals: many traders use the nine-count alone (a TD9) as a caution flag against chasing late entries rather than as a standalone trigger.
- In confluence with magnitude tools: a thirteen completing while RSI diverges at an extreme stacks two different kinds of exhaustion evidence, counting and magnitude, which is stronger than either alone.
- Across timeframes: weekly counts frame the campaign while daily counts time entries within it, with agreement between the two treated as the higher-conviction configuration.
TD Sequential vs other exhaustion reads
RSI: RSI measures the magnitude of recent gains against losses and saturates at extremes; Sequential counts bar relationships and completes at fixed counts. One asks how hard the move has run, the other how long it has kept beating its own past, and they disagree often enough to be complementary.
Regular Bullish/bearish Divergence: Divergence infers exhaustion from an oscillator failing to confirm price; Sequential infers it from the count structure of price itself, no oscillator involved. Both are conditions rather than triggers, and the classic pairing demands both before fading a trend.
Overbought/oversold: Zone readings mark a stretched state that can persist indefinitely. A completed count is an event, arriving once per sequence, with defined follow-ups (perfection, flip, countdown). The state says stretched; the count says the stretching pattern just completed its script.
Concept family
Momentum & Oscillators
91 concepts mapped · 91 in the Library
TD Sequential FAQ
Turn TD Sequential into a trading strategy.
Take any implementation from this page into Quant, then build on it, backtest it on real data, and keep refining it in conversation.