Concept
Polarized Fractal Efficiency
Polarized Fractal Efficiency is a Momentum & Oscillators concept. The Library holds 1 implementation, a working definition you can pull into Quant.
PFE
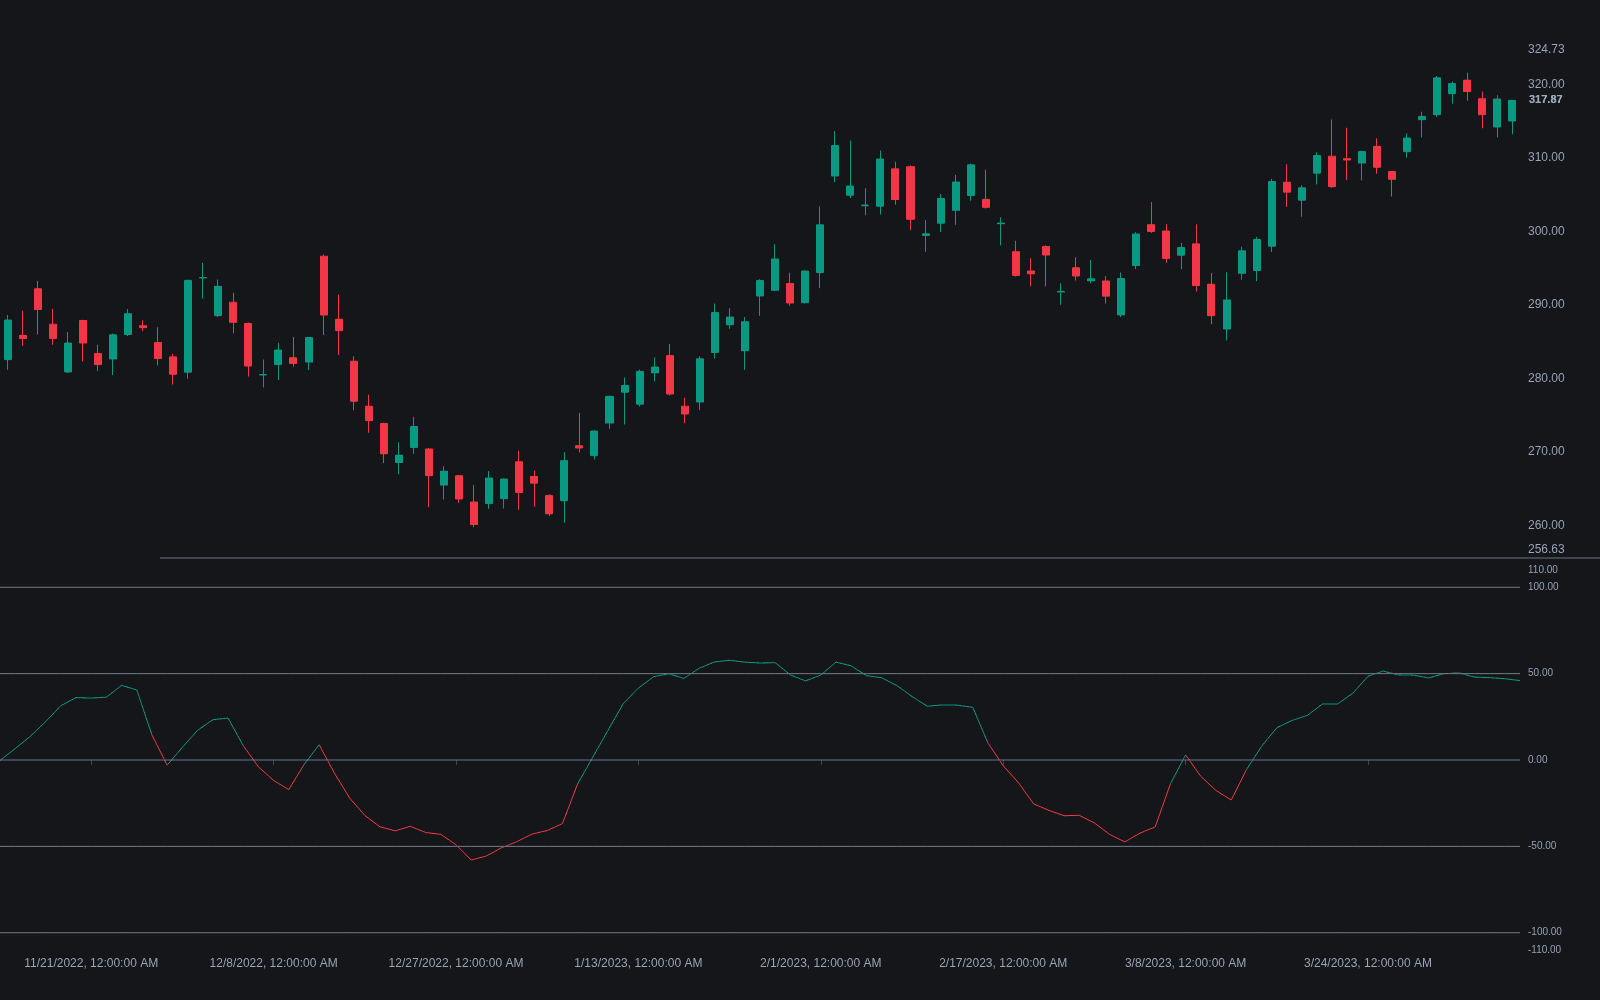
Top Polarized Fractal Efficiency indicator
The top custom implementation, built on the original standard Polarized Fractal Efficiency formula.
1 total
The Polarized Fractal Efficiency implementation below can become a backtested trading strategy — describe your rules and Quant writes the code.
What is Polarized Fractal Efficiency?
Polarized Fractal Efficiency (PFE) measures how efficiently price traveled from one point to another over a lookback window, with the sign of the reading set by the direction of the net move. The idea borrows from fractal geometry: compare the straight-line distance between the first and last close with the actual bar-by-bar path length price traced between them. A smooth, one-way trend covers its distance with little wasted motion and scores near +100 or -100; a choppy market that zigzags to nowhere scores near zero. The concept was introduced by Hans Hannula in the 1990s.
The 'polarized' part is what separates PFE from plain efficiency measures: the ratio is multiplied by -1 when the net change over the window is down, so the indicator is both a trendiness gauge and a direction gauge in one bounded line. Most implementations then smooth the raw ratio with a short exponential average, commonly 5 periods, to keep single bars from whipping the reading around.
Traders care because most tools assume a regime: trend-following logic bleeds in chop, mean-reversion logic bleeds in trends. PFE offers one number for that regime call. Its limits are equally plain: it is computed from past closes, so it confirms efficiency after the fact rather than predicting it, and the mix of price units and bar counts inside the square roots means readings are sensitive to timeframe and to the instrument's scale in ways that pure ratios are not.
How it's calculated
PFE compares the direct distance across the window with the summed bar-to-bar path length, signs the result, and smooths it.
Some implementations divide the price change by close[n] before squaring, to reduce scale sensitivity; readings then differ from the plain form.
The +n^2 and +1 terms treat time as a distance dimension, which is why the reading depends on bar count as well as price movement.
How traders use it
- As a regime filter: readings persistently above roughly +50 or below -50 are treated as trending conditions where pullback entries in the trend direction are preferred, while readings oscillating around zero argue for range tactics or standing aside.
- As a zero-line direction cue: crosses of zero mark the point where the net move over the window flips sign, though in chop those crosses arrive constantly and are best ignored without a strength reading behind them.
- As an exhaustion watch: a PFE that has pinned near an extreme and then starts bending back toward zero suggests the trend's efficiency is decaying, often before price itself breaks structure.
- In systematic work as a switch between trend and mean-reversion modules, a role it shares with the Kaufman efficiency ratio and the Choppiness Index.
- With the honest caveat that smoothing delays the regime call: by the time PFE confirms an efficient trend, a meaningful part of the move has usually already printed.
PFE vs other trendiness measures
Kaufman efficiency ratio: Kaufman's ratio divides net change by the sum of absolute changes and is unsigned, bounded 0 to 1, and unit-free. PFE adds time into the distance math, carries the direction sign, and is scaled to plus or minus 100.
Fractal dimension: Fractal dimension estimates the roughness of the price path itself, rising as price gets choppier. PFE inverts the framing: high absolute readings mean smooth, and it adds a direction sign that dimension estimates lack.
Vertical Horizontal Filter: The VHF divides the window's range by summed close-to-close movement, another unsigned trendiness score. PFE's polarization makes it usable as a direction indicator too, at the cost of noisier zero crossings.
Concept family
Momentum & Oscillators
91 concepts mapped · 91 in the Library
Polarized Fractal Efficiency FAQ
Turn Polarized Fractal Efficiency into a trading strategy.
Take the implementation from this page into Quant, then build on it, backtest it on real data, and keep refining it in conversation.