Concept
Elder Impulse System
Elder Impulse System is a Momentum & Oscillators concept. The Library holds 1 implementation, a working definition you can pull into Quant.
The standard Elder Impulse System indicator
Elder Impulse System exactly as classically defined: the faithful reference build of the original formula, free to run in Quant.
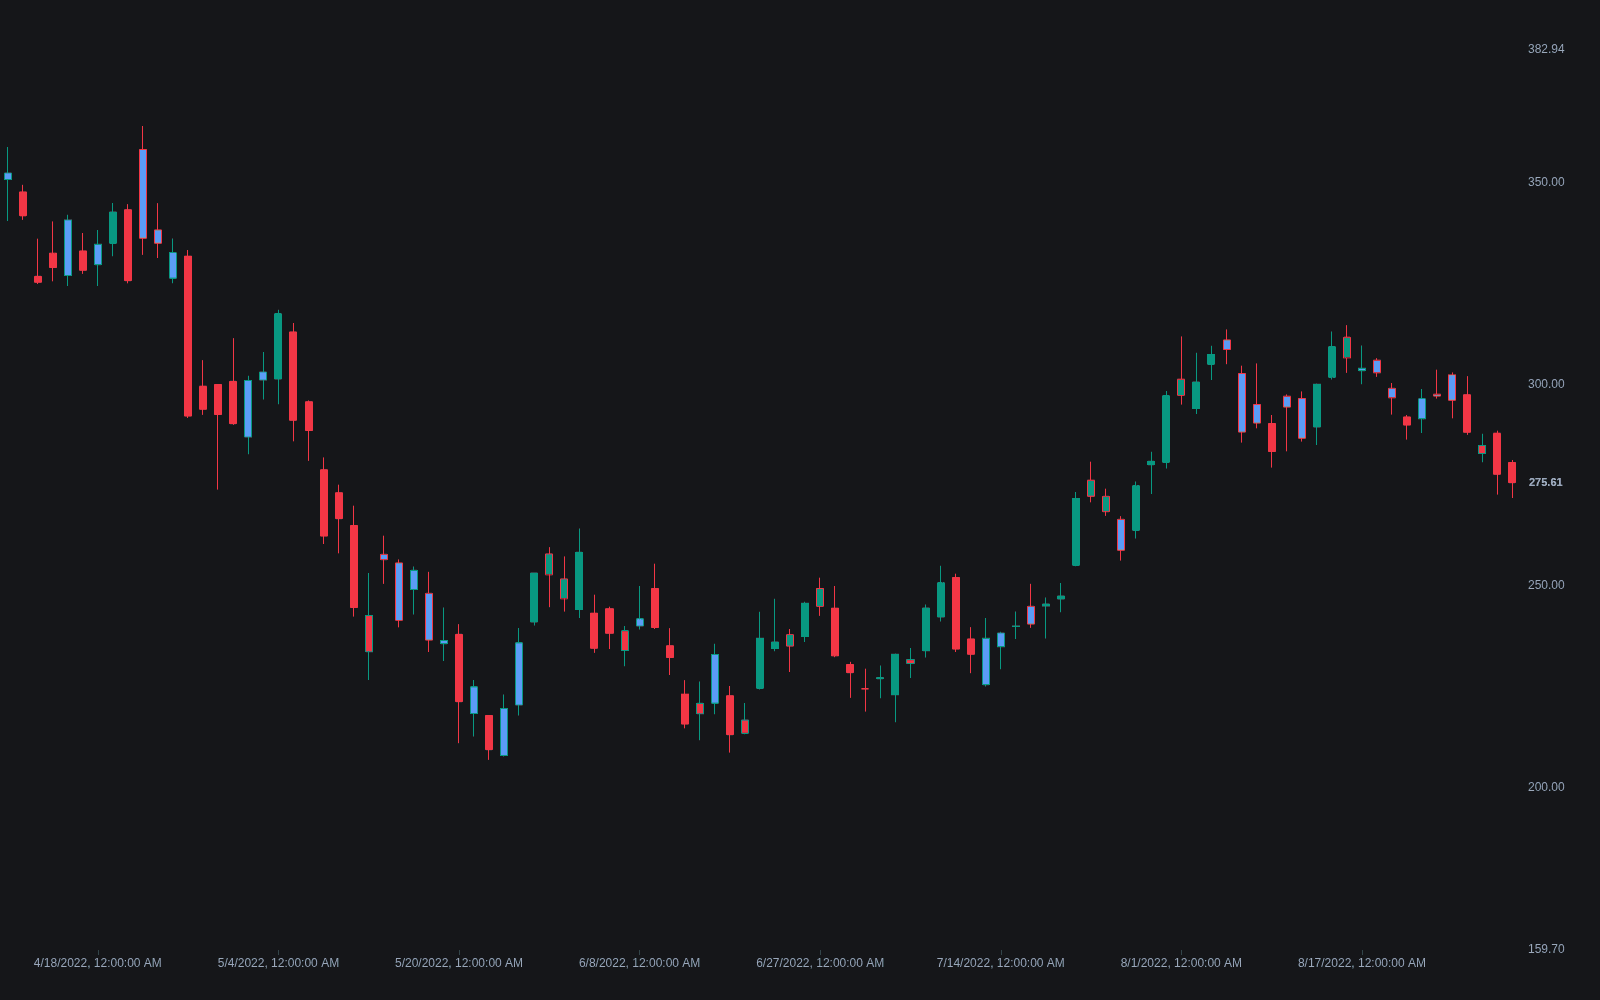
What is the Elder Impulse System?
The Elder Impulse System is a bar-coloring method from Alexander Elder that combines one trend input and one momentum input. Each bar is colored by the slope of an exponential moving average (commonly 13-period) and the slope of the MACD histogram: green when both are rising, red when both are falling, and blue (neutral) when the two disagree.
Elder introduced the system in Come Into My Trading Room (2002), and it is now widely available in charting platforms and community scripts, usually applied as a paint over the price bars rather than as a separate pane. The logic is deliberately minimal: the EMA slope answers whether the market's inertia points up or down, the histogram slope answers whether momentum is building or fading, and requiring agreement compresses two continuous indicators into three discrete states.
Elder described it as a censorship system rather than a signal generator: it tells you what you may not do. Green bars forbid shorting, red bars forbid buying, and blue bars permit either side or standing aside. In his triple-screen approach the impulse color on a higher timeframe gates which direction may be traded on the lower one, making it a permission filter applied from above rather than an entry technique.
The design addresses the most common failure of momentum tools used alone: an oscillator such as the stochastic oscillator or RSI can flash oversold repeatedly while a downtrend grinds on. By insisting that trend and momentum agree before a side of the market is even allowed, the impulse system forces counter-trend ideas to wait until the pressure against them stops worsening, without claiming to predict the next bar.
How to identify the Elder Impulse System on a chart
The impulse system is applied rather than spotted, but reading it correctly requires knowing exactly what each color encodes.
- 1Load an Elder Impulse script or built-in bar paint; every price bar turns green, red, or blue.
- 2Verify the inputs: the classic build compares the current bar's 13-period EMA against the prior bar's, and the current MACD histogram (12, 26, 9) against the prior one.
- 3Read green as both slopes rising, red as both falling, and blue as disagreement between the two.
- 4Track sequences rather than single bars: red fading to blue and then green is the classic bottoming progression, while an isolated flip inside chop means little.
- 5For Elder's intended use, check the color on the timeframe above your trading timeframe first, since that one does the censoring.
How it's calculated
Colors each bar by whether the 13-period EMA slope (trend) and the MACD histogram slope (momentum) agree.
Elder treats it as a censorship rule: green forbids new shorts, red forbids new longs, blue leaves both sides available.
Defaults are a 13-period EMA with the 12-26-9 MACD histogram; Elder reads the color on a longer timeframe as well as the trading timeframe, in the spirit of his triple screen method.
How traders use it
- As a trade censor: long entries are considered only while the impulse is green and shorts only while it is red, with blue treated as unrestricted or as a stand-aside state depending on the plan.
- As a timing cue: the color flip out of red or blue into green after a pullback is a common continuation prompt, still requiring its own entry trigger and exit rules.
- As a multi-timeframe gate: weekly impulse color restricts daily trades, or daily restricts intraday, following Elder's original triple-screen usage.
- Combined with divergence work: community scripts overlay regular bullish/bearish divergence detection on the MACD histogram, so the divergence sets up the idea and the impulse color flip times the entry.
- As an exit manager: a long held through green bars is tightened or partially closed when the color degrades to blue, and many plans treat a full flip to red as a hard exit.
- As a scan filter: screening a watchlist by weekly impulse color sorts symbols into long-only, short-only, and unrestricted groups before detailed chart work begins.
Elder Impulse System vs related momentum tools
MACD: The impulse system consumes only the MACD histogram's bar-to-bar slope and discards its level, its lines, and its crossovers. MACD proper offers magnitude and divergence information that the impulse deliberately trades away for a simple three-state answer.
Momentum: A raw momentum line measures the speed of price change as a continuous, unbounded series the trader must interpret. The impulse system pre-interprets: it reduces trend plus momentum agreement to green, red, or blue and asks for no further reading.
Stochastic Oscillator: The stochastic locates the close within its recent range to flag overbought and oversold turns, a mean-reversion instinct. The impulse system is the opposite temperament: it exists to keep the trader aligned with the prevailing pressure, not fading it.
Concept family
Momentum & Oscillators
91 concepts mapped · 91 in the Library
Elder Impulse System FAQ
Turn Elder Impulse System into a trading strategy.
Take the implementation from this page into Quant, then build on it, backtest it on real data, and keep refining it in conversation.