Concept
Stochastic RSI
Stochastic RSI is a Momentum & Oscillators concept. The Library holds 1 implementation, a working definition you can pull into Quant.
The standard Stochastic RSI indicator
Stochastic RSI exactly as classically defined: the faithful reference build of the original formula, free to run in Quant.
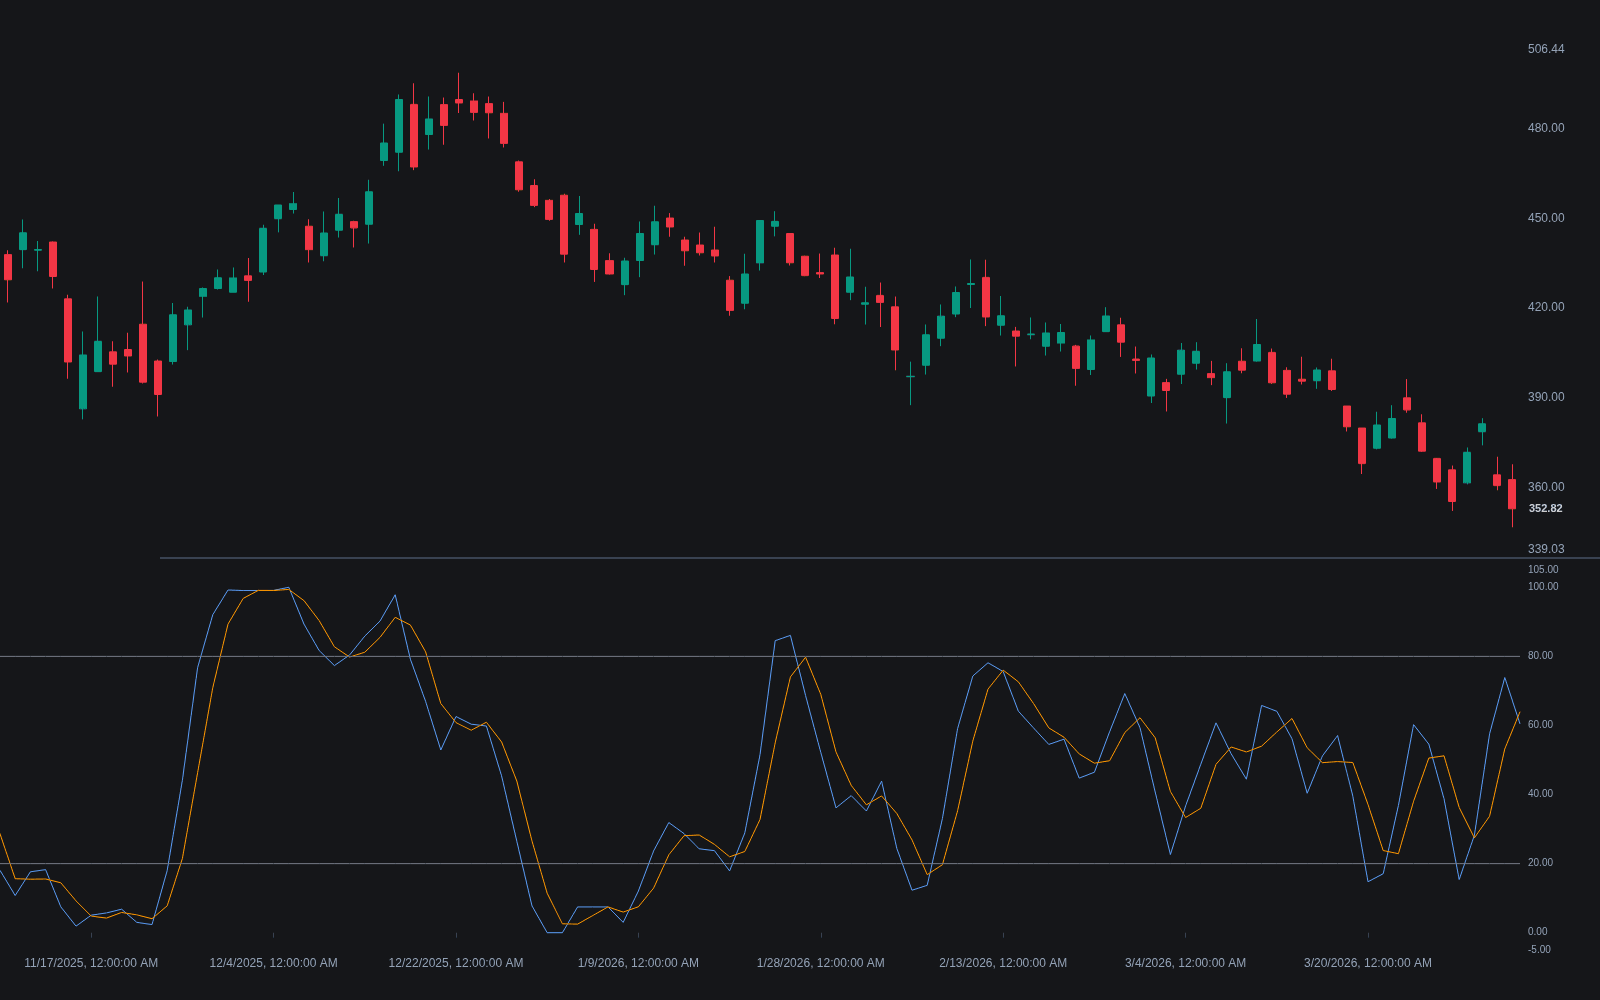
What is the Stochastic RSI?
The Stochastic RSI applies the stochastic formula to RSI values instead of prices. Introduced by Tushar Chande and Stanley Kroll in The New Technical Trader (1994), it measures where the current RSI sits within its own recent range: current RSI minus the lowest RSI of the lookback, divided by the highest RSI minus the lowest RSI. The result runs from 0 to 1, commonly rescaled to 0-100, with 14 the usual length for both the RSI and the stochastic window.
The motivation was RSI's habit of trending without touching its extremes: in a sustained move RSI can hold mid-scale for long stretches and never trigger 70/30 rules. Re-scaling RSI against its own range fixes that mechanically, because the Stochastic Oscillator arithmetic prints 100 whenever RSI makes a lookback high and 0 whenever it makes a lookback low. Platforms typically smooth the raw line with a 3-period %K average and a 3-period %D signal.
The trade-off is the whole story: the Stochastic RSI reaches overbought/oversold territory far more often than RSI itself, which makes it useful for timing and noisy as a standalone signal. It is an indicator of an indicator, two derivations removed from price, so it can pin at a boundary on a modest move. Many workflows subordinate it to a trend filter or structure rather than trading its crosses in isolation.
How to calculate the Stochastic RSI
The calculation runs a stochastic over an RSI series instead of over price.
- 1Compute RSI on the chosen source, typically over 14 periods.
- 2Across the most recent N RSI values (14 is the common default), record the highest and lowest readings.
- 3Divide (current RSI minus the lowest RSI) by (highest RSI minus the lowest RSI). Multiply by 100 for the 0-100 display; by construction the value touches a boundary whenever RSI makes an N-period extreme.
- 4Smooth for reading: %K is commonly a 3-period simple average of the raw line, %D a 3-period average of %K, with 80/20 (or 0.8/0.2) as the conventional zones.
How it's calculated
A stochastic oscillator applied to RSI values, measuring where RSI sits inside its own recent range.
Chande and Kroll's original formula is unscaled between 0 and 1; platforms multiply by 100 and add the %K and %D smoothing.
If RSI is flat over the window, HH_t equals LL_t and the ratio is undefined; implementations output 0 or hold the prior value.
As a stochastic of an oscillator it tags 0 and 100 far more often than RSI reaches its own extremes.
How traders use it
- As a pullback timer inside trends: with a higher-timeframe trend filter defining direction, an oversold Stochastic RSI hooking back up times entries with the trend while skipping counter-trend fades.
- As a fast mean-reversion gauge in ranges, where its frequent trips to the extremes match the cadence of range rotation better than the slower parent RSI does.
- As a crossover trigger: %K crossing %D inherits the stochastic's grammar, and many workflows only honor crosses that occur inside the extreme zones to filter mid-scale noise.
- As a normalized component in composites: because it maps RSI onto a fixed 0 to 1 range, it slots cleanly into scoring systems and dashboards that need comparable scales across inputs.
Stochastic RSI vs related tools
RSI: RSI is the raw material: smoothed strength of up closes versus down closes, bounded 0-100 but slow to reach its extremes. The Stochastic RSI re-scales those values against their own recent range, so it cycles hard between 0 and 100 while RSI drifts mid-band.
Stochastic Oscillator: Identical formula, different input: the stochastic locates the close within the price range, the Stochastic RSI locates RSI within the RSI range. One derivation from price versus two, which is why the Stochastic RSI is faster and jumpier.
RSI-2: RSI-2 speeds RSI up by shrinking the lookback to two periods instead of re-scaling: same arithmetic, hair-trigger length. The Stochastic RSI keeps the standard RSI and changes the lens through which it is read.
Connors RSI: Connors RSI blends three components (a short RSI of price, an RSI of the up/down streak, and a percent rank of returns) into one composite. Both aim at faster mean-reversion timing than classic RSI, one by composition, the other by range-scaling.
Concept family
Momentum & Oscillators
91 concepts mapped · 91 in the Library
Stochastic RSI FAQ
Turn Stochastic RSI into a trading strategy.
Take the implementation from this page into Quant, then build on it, backtest it on real data, and keep refining it in conversation.