Concept
Detrended Price Oscillator
Detrended Price Oscillator is a Momentum & Oscillators concept. The Library holds 1 implementation, a working definition you can pull into Quant.
DPO
The standard Detrended Price Oscillator indicator
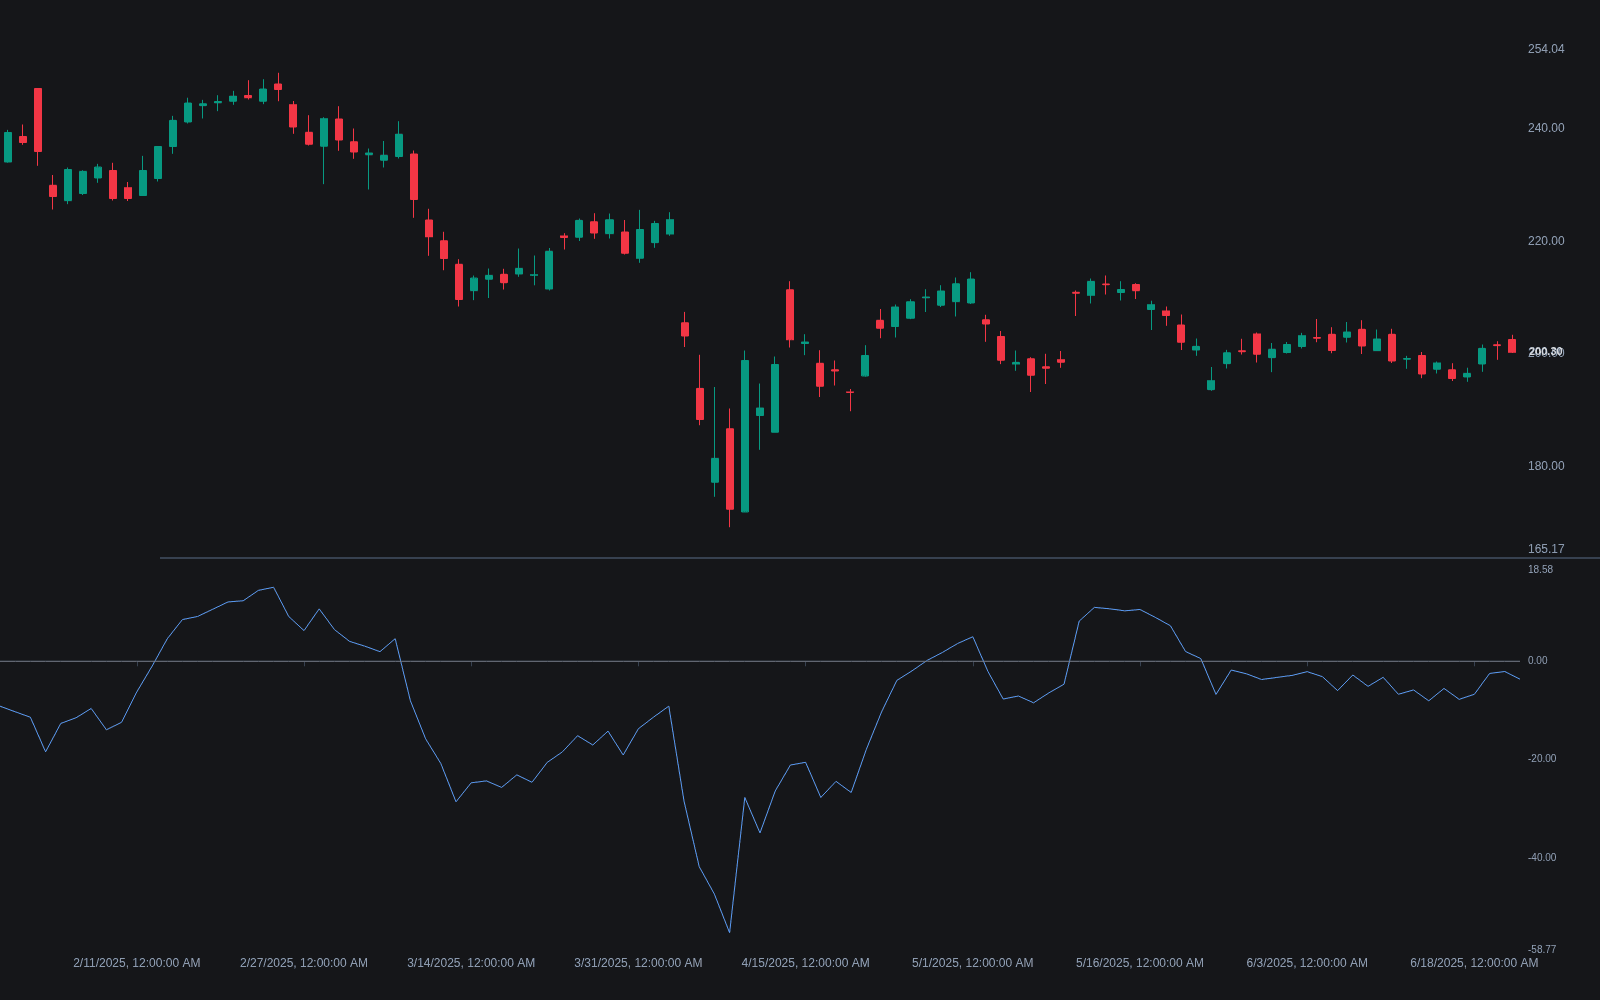
Detrended Price Oscillator exactly as classically defined: the faithful reference build of the original formula, free to run in Quant.
What is the Detrended Price Oscillator?
The Detrended Price Oscillator (DPO) removes the longer trend from price so that shorter cycles stand out. It does this with a deliberately simple trick: subtract a displaced simple moving average from price. The average is shifted back by roughly half its length, which centers it on the data it summarizes, and the difference between price and that centered average is plotted as an oscillator around zero. What remains is, approximately, the cyclical component shorter than the lookback.
The DPO exists because trend contaminates cycle measurement. A raw oscillator like ROC mixes trend and cycle together, so its peaks and troughs drift with the trend. By centering the average, the DPO aligns the trend estimate with the price it is being subtracted from, making cycle peaks and troughs easier to space and count. This is why the indicator is used less for signals and more for estimating cycle length, a manual cousin of formal dominant cycle measurement.
The displacement has an important consequence that trips up newcomers: because the average is shifted back, the most recent DPO values in many charting implementations correspond to price several bars ago, or the plot simply ends before the current bar. The DPO is therefore not a real-time timing tool in its pure form; it is an analytical lens on completed data. Its authorship is not clearly attributed, and it appears across charting platforms as a standard study.
How it's calculated
The standard form subtracts a backward-displaced simple moving average from price.
Equivalently, some platforms compute close minus the SMA shifted back k bars and plot the result k bars in the past; the two descriptions produce the same curve.
Because of the shift, the plot lags or terminates before the most recent bars in faithful implementations. Versions that plot up to the current bar have quietly changed the alignment.
The oscillator is denominated in price units and is unbounded, so absolute values are not comparable across instruments.
How traders use it
- To estimate cycle length: traders measure the bar count between successive DPO troughs (or peaks) and use the typical spacing to anticipate when the next low is due, accepting that cycle lengths drift.
- To choose indicator settings: an estimated cycle length from the DPO can inform lookbacks for other tools, for example setting an oscillator period near half the measured cycle.
- As an overextension gauge: unusually large positive or negative DPO readings relative to the instrument's recent history flag stretched departures from the local mean.
- For historical structure analysis: because the plot is displaced, it suits studying how past cycles behaved rather than triggering live entries.
- With clear limitations: the displacement means signals arrive late or not at all in real time, and the fixed lookback only isolates cycles shorter than n, so the choice of n shapes what you see.
DPO vs. adjacent oscillators
ROC: ROC measures the speed of price change over a lookback and is usable in real time. The DPO measures displacement from a centered average and sacrifices timeliness to make cycle spacing cleaner.
MACD: MACD spreads two trailing EMAs and is built for signal generation via crossovers. The DPO uses a single centered SMA and is built for cycle inspection, not crossovers.
Momentum: Raw momentum retains the trend inside its reading, so its zero line drifts in meaning during trends. The DPO explicitly subtracts a trend estimate so its oscillation reflects the shorter cycle.
Concept family
Momentum & Oscillators
91 concepts mapped · 91 in the Library
Detrended Price Oscillator FAQ
Turn Detrended Price Oscillator into a trading strategy.
Take the implementation from this page into Quant, then build on it, backtest it on real data, and keep refining it in conversation.