Concept
Firefly Oscillator
Firefly Oscillator is a Momentum & Oscillators concept. The Library holds 1 implementation, a working definition you can pull into Quant.
Top Firefly Oscillator indicator
The top custom implementation, built on the original standard Firefly Oscillator formula.
1 total
The Firefly Oscillator implementation below can become a backtested trading strategy — describe your rules and Quant writes the code.
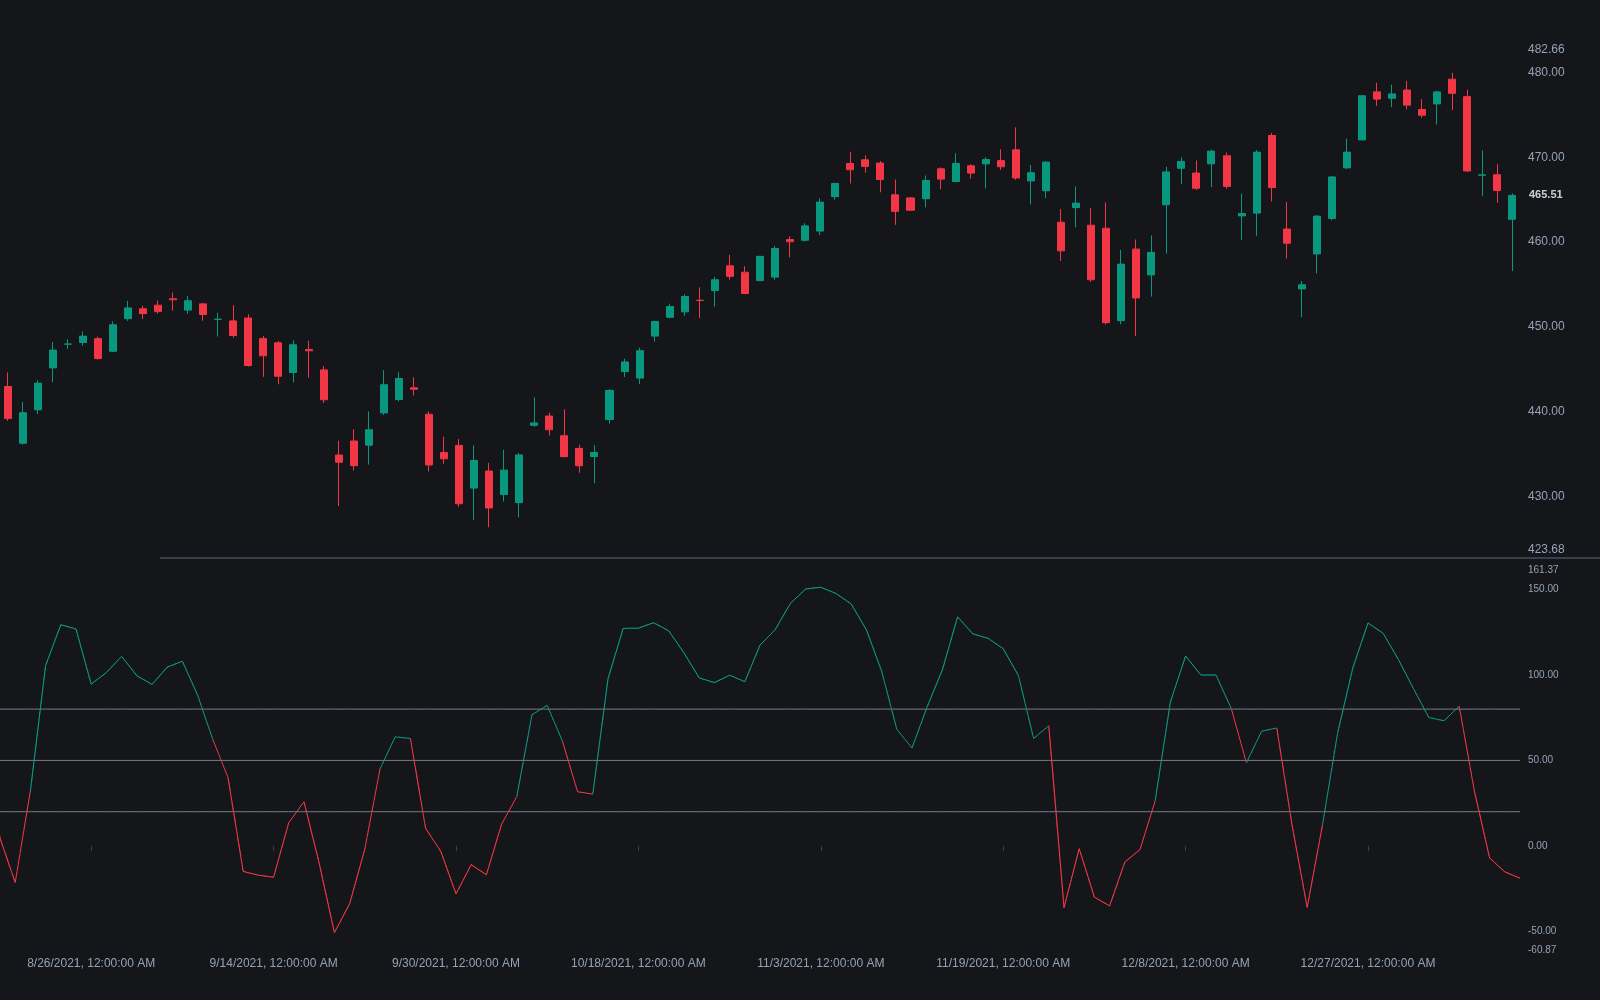
What is the Firefly oscillator?
The Firefly oscillator is a momentum indicator that measures how far a weighted price sits from its own recent average, in units of recent variability, and then double-smooths that reading into a 0 to 100 line centered on 50. At its core it is a smoothed z-score: price stretched well above its norm produces high readings, price stretched below produces low ones, and the smoothing turns the raw statistical series into a swing-friendly curve. The name comes from the way plotted implementations often flare (light up) at momentum extremes.
The indicator circulated through trading forums and community script libraries rather than a book or journal, so no single authoritative specification exists; the widely copied charting implementations share the same pipeline of weighted price, z-score, zero-lag style double smoothing, and rescaling. It belongs to the same design family as other normalized-and-smoothed oscillators in which a statistical deviation measure is dressed up for visual swing trading.
Traders use it as a bounded momentum and exhaustion gauge: the normalization adapts automatically to each market's volatility, and the aggressive smoothing produces rounded swings whose turns are easy to read, at the usual cost of added lag.
How it's calculated
A weighted price is converted to a z-score against its own average and deviation, double-smoothed with a zero-lag adjustment, and rescaled to 0 to 100. Implementations vary; this is the common form.
There is no canonical published source; community implementations differ in the weighted price definition, smoothing lengths, and whether the zero-lag adjustment is applied.
Because the underlying z-score is theoretically unbounded, extreme bars can push readings slightly outside 0 to 100 in some implementations.
How traders use it
- As an exhaustion gauge in ranges: readings stretched toward the top or bottom of the scale mark statistically unusual displacement from the recent mean, and swing traders fade them back toward 50 when no trend regime is in force.
- As a momentum confirmation tool: crosses of the 50 midline in the direction of the prevailing trend are used as continuation triggers, similar to centerline logic on other bounded oscillators.
- For divergence reading: the heavy smoothing makes swing highs and lows on the oscillator well defined, so comparing their sequence against price extremes is straightforward.
- Its limitations are the short default windows and lack of a standard: a 10-bar deviation basis makes readings twitchy on noisy instruments, different platform versions disagree in detail, and like the wave trend oscillator it can hug an extreme throughout a strong trend, punishing anyone who fades it mechanically.
Firefly oscillator vs statistical and smoothed relatives
Z-score: A raw z-score of price is the statistical core of the Firefly, unsmoothed and unbounded. The Firefly wraps it in a weighted price input, double smoothing, and a 0 to 100 rescale, trading statistical purity for chart readability.
Wave trend oscillator: The wave trend oscillator follows an almost parallel recipe, normalizing a typical-price deviation by mean absolute deviation and double-smoothing with EMAs. The two often look similar; the Firefly's standard deviation denominator and zero-lag pass make it slightly snappier in most implementations.
RSI: RSI normalizes by the balance of up versus down closes, not by dispersion, so it measures directional persistence rather than statistical stretch. The Firefly can read extreme after one violent bar; RSI needs a run of one-sided closes to get there.
Concept family
Momentum & Oscillators
91 concepts mapped · 91 in the Library
Firefly Oscillator FAQ
Turn Firefly Oscillator into a trading strategy.
Take the implementation from this page into Quant, then build on it, backtest it on real data, and keep refining it in conversation.