Concept
Stochastic Pop
Stochastic Pop is a Momentum & Oscillators concept. The Library holds 1 implementation, a working definition you can pull into Quant.
Schwager
Top Stochastic Pop indicator
The top custom implementation, built on the original standard Stochastic Pop formula.
1 total
This Stochastic Pop implementation is strategy-ready: open it in Quant, set your rules, and it backtests automatically.
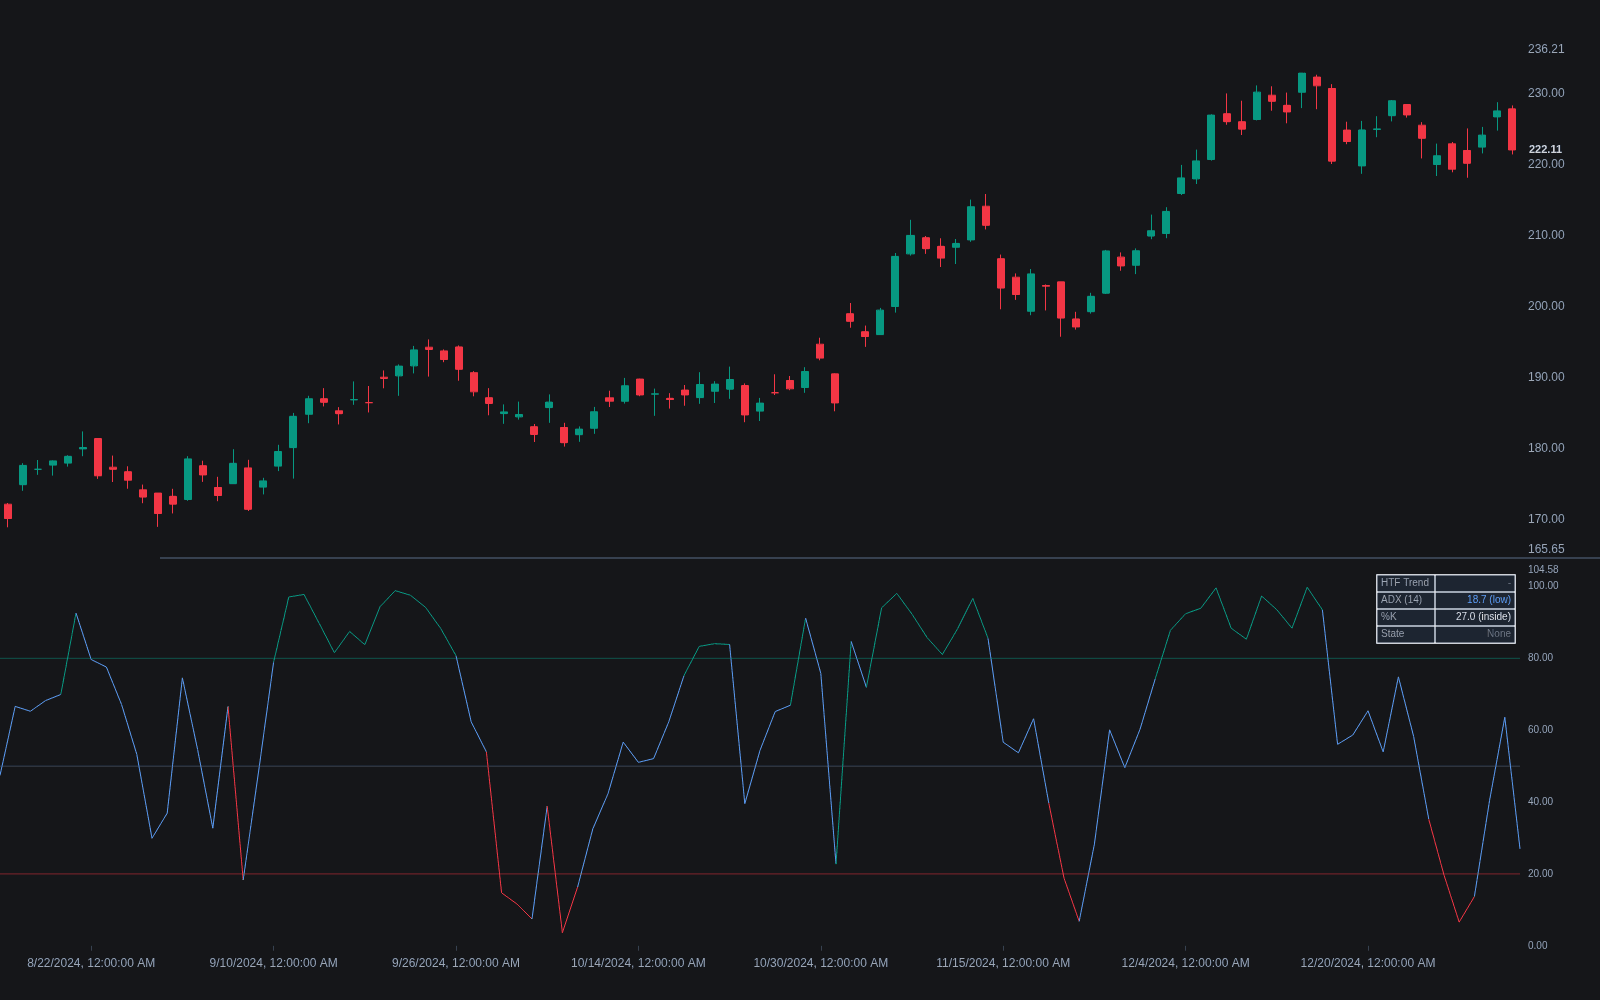
What is a Stochastic Pop?
A Stochastic Pop deliberately inverts the textbook reading of the stochastic oscillator. Instead of treating a surge above the upper band (commonly 75 or 80) as overbought and due to fade, the pop reads it as ignition: price is moving forcefully enough to pin the oscillator at its ceiling, and the expectation is continuation while it stays there. Jake Bernstein popularized the tactic, and David Steckler's refinement takes pops only in the direction of the higher-timeframe trend and after a low-ADX lull, so the signal marks a momentum burst out of a quiet range.
Bernstein, a futures analyst and prolific trading author, described the pop in his 1990s day-trading work as a continuation entry rather than a reversal fade. Steckler's version, published in Technical Analysis of Stocks & Commodities in 2000, added the screens most implementations copy: a supportive higher-timeframe trend, a low ADX reading to mark contraction, and the push through the band as trigger. The ChrisMoody study in this library adapts Bernstein's method directly.
The bearish mirror, sometimes called the drop, triggers on a plunge below the lower band. Exits are typically symmetric: hold while the oscillator stays embedded in the extreme zone, close when it hooks back out, treating the loss of saturation as the burst being spent. The known failure mode is the fake pop, a brief poke into the zone that reverses at once, which is why the filtered versions demand trend and volatility context before entry.
The pop earns its place less as a standalone system than as a clean demonstration that bounded oscillators are regime-dependent: embedded extremes are a trend signature rather than an anomaly. The lesson transfers to RSI, where holding above 70 characterizes strong uptrends, to CCI strategies that buy +100 breaks, and to any read where a genuine momentum burst must be distinguished from exhaustion.
How to identify a Stochastic Pop on a chart
The setup has a quiet phase and an ignition phase, and both need to be visible.
- 1Establish the backdrop: the higher timeframe should be trending in the trade's direction (Steckler's version used the larger trend to filter signals).
- 2Confirm contraction: a low ADX reading or visibly narrowing bars shows the market has been resting rather than already running.
- 3Watch for a fast stochastic push through the upper threshold, 75 or 80 by convention, ideally as price clears the range's edge.
- 4Treat the pop bar as the entry area, with invalidation beneath the breakout structure; volume expansion on the pop bar strengthens the case.
- 5Monitor for embedding: the signal stays alive while readings hold beyond the threshold, and a quick hook back through it is the fake-pop warning.
How it's calculated
A continuation setup that reads a stochastic surge into its extreme zone as the start of a momentum burst rather than an overbought or oversold reversal.
%K is the standard Stochastic Oscillator; the pop inverts its textbook reading by buying strength above U instead of fading it.
Jake Bernstein introduced the pop; David Steckler's refinement (Trading Stochastic Pops, TASC, August 2000) adds filters: a weekly stochastic above 50 for trend bias, ADX(14) below 20 marking contraction, and above-average volume on the trigger bar.
Some implementations smooth %K over 3 bars first, which delays triggers slightly.
How traders use it
- As a breakout-style entry: buy when %K pops above the upper threshold out of compressed, low-ADX conditions aligned with the larger trend, with the bearish drop mirrored below the lower threshold.
- As an exit convention: stay in while the stochastic remains embedded beyond the threshold, exit when it hooks back through it, or trail a stop so a fake pop costs a defined amount.
- As a lesson in oscillator context: the same reading that means fade-the-move inside a range means strength during an expansion, so the pop framework serves as a working example of regime-dependent interpretation of bounded oscillators.
- As a screening recipe: scanning for markets where the higher timeframe trends, ADX is low, and the stochastic has just crossed the band, a checklist that suits scanners because every condition is computable.
- As one of several momentum-burst expressions: the same continuation idea can be voiced with ROC thrusts or MACD histogram expansion, with the pop reserved for markets where the range anchor makes sense.
Stochastic Pop vs. related oscillator reads
Stochastic Oscillator: The parent tool read conventionally treats extremes as reversal risk. The pop is a regime-specific reinterpretation of the identical line, valid in expansions where the classic fade is weakest.
Overbought/oversold: The overbought/oversold framework treats band violations as stretch to be faded; the pop treats them as fuel. Which applies is a regime question, settled by trend filters and volatility contraction rather than by the oscillator itself.
Stochastic Momentum Index: A different route to taming the stochastic: the SMI double-smooths and re-centers the line so extremes mark stretch more reliably, while the pop keeps the raw fast line and changes the interpretation instead.
Concept family
Momentum & Oscillators
91 concepts mapped · 91 in the Library
Stochastic Pop FAQ
Turn Stochastic Pop into a trading strategy.
Take the implementation from this page into Quant, then build on it, backtest it on real data, and keep refining it in conversation.