Concept
TRIX
TRIX, also known as triple exponential average, is a Momentum & Oscillators concept. The Library holds 1 implementation, a working definition you can pull into Quant.
The standard TRIX indicator
TRIX exactly as classically defined: the faithful reference build of the original formula, free to run in Quant.
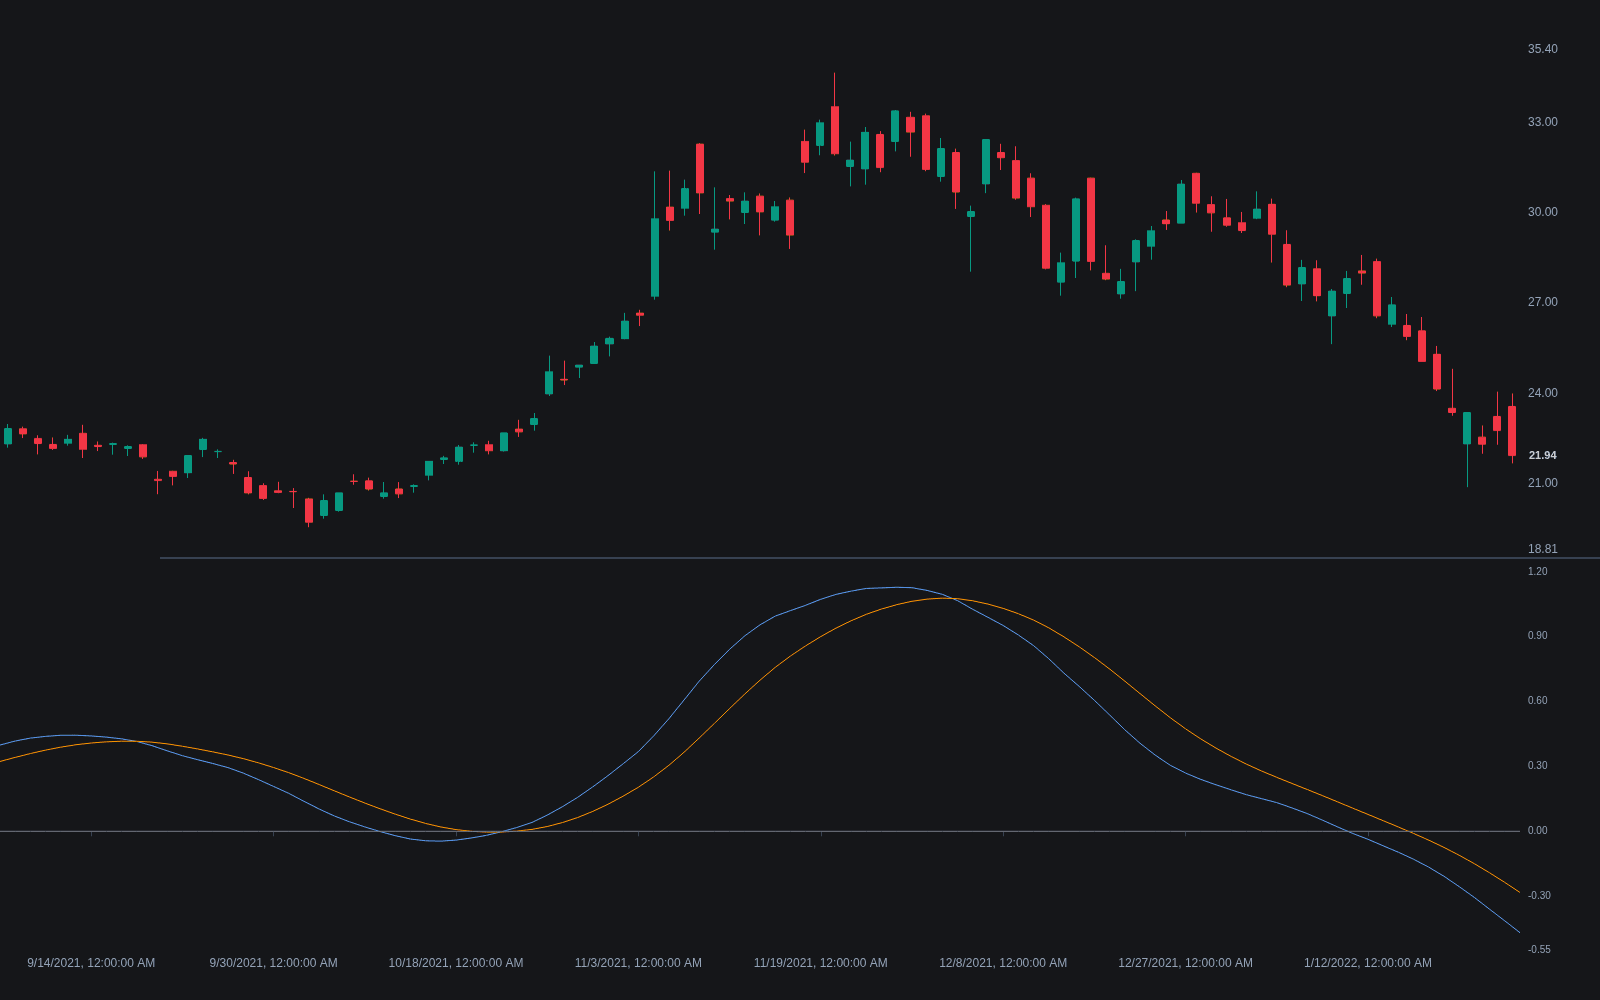
What is TRIX?
TRIX is the one-bar rate of change of a triple-smoothed exponential moving average. Introduced by Jack Hutson in Technical Analysis of Stocks & Commodities magazine in the early 1980s, it runs the close through an EMA three times with the same length, then plots the percentage change of that heavily filtered series from one bar to the next. The line oscillates around zero: positive while the triple-smoothed trend is rising, negative while it is falling.
The triple pass is the point. Each smoothing stage suppresses cycles shorter than the chosen length, so TRIX ignores fluctuations the filter deems noise, at the cost of lag. Common published settings run the same length (15 bars is typical) through all three passes, with a shorter EMA of the TRIX line itself serving as a signal line.
Because the output is a one-bar percent change, TRIX values are small and scale with the instrument's volatility and the chosen length: a quiet large-cap on a 15-period setting produces readings in hundredths of a percent, while a volatile crypto pair swings far wider. Platforms handle this differently, some multiplying by 100 or 10,000 for legibility, so absolute levels are not comparable across charts. What carries between markets is the sign, the slope, and the relationship to the signal line, typically a 9-period EMA of TRIX itself.
The design buys noise immunity with lag, and the price is real. Three EMA passes mean the line confirms a turn well after it began, so zero-line crosses in fast reversals arrive late enough to give back a meaningful share of the move. In ranges, TRIX drifts near zero and its crosses degrade toward coin flips. It behaves best as a slow regime and confirmation layer on trending instruments, with entries timed by something faster, and worst as a standalone trigger on choppy ones.
How to identify TRIX signals on charts
TRIX plots in a subpanel as a single smooth line around zero, usually with a signal line. Reading it comes down to the zero line, the slope, and disagreements with price.
- 1Apply the indicator with the default 15-period length and note the scale your platform uses; the values are one-bar percent changes of a triple-smoothed close, so they will be small.
- 2Mark which side of zero the line has held recently: extended one-sided stretches define the filtered trend, and crosses between them are the regime events.
- 3Overlay the signal line, commonly a 9-period EMA of TRIX, and watch for crosses through it; these fire earlier than zero crosses and correspondingly fail more often.
- 4Compare the line's swing highs and lows with price at new extremes: price making a higher high while TRIX makes a lower high is a regular bearish divergence, rarer here than on faster oscillators and worth more attention when it appears.
- 5Walk the settings across your market's history before trusting them: longer lengths suppress more noise and arrive later, and the right balance depends on how long the trends you trade actually last.
How it's calculated
TRIX is the 1-bar percent rate of change of a triple-smoothed exponential moving average of the close, an oscillator centered on zero.
The same n is applied three times, so the effective smoothing is much heavier than one EMA of that length.
Some platforms run the EMAs on the natural log of the close and scale the 1-bar change by 10000 instead of 100; the shape is nearly identical.
Signals are read from zero-line crosses or TRIX/signal crossovers.
How traders use it
- As a trend-regime read: the zero line separates a rising filtered trend from a falling one, and staying on one side of zero defines regime the way centerline rules do on faster oscillators.
- For signal-line crossovers: TRIX crossing its own EMA turns earlier than the zero cross, mirroring MACD signal-line practice with more smoothing behind it.
- For divergence against price at swing extremes, where the heavy filtering makes divergences rarer but less prone to one-bar noise.
- As stretch context: TRIX is unbounded, so overbought/oversold reads come from comparing the current value against its own recent range rather than fixed levels; readings far outside that range flag a trend running hot, not an automatic reversal.
- As the slow layer under a faster oscillator: pairing TRIX regime with RSI or stochastic timing lets the smooth line say which side to trade and the fast line say when, a division of labor that suits its lag profile.
TRIX vs related momentum oscillators
MACD: MACD measures the spread between a fast and a slow EMA, so it responds whenever the two separate; TRIX differentiates a single triple-smoothed average, so it responds only when the filtered trend changes slope. TRIX is the quieter of the two, later and cleaner.
ROC: Rate of change is raw: the percent move over N bars, noise included. TRIX is the same percentage idea applied to a series smoothed three times, trading ROC's immediacy for a line that ignores most one-bar events.
Stochastic Momentum Index: The SMI double-smooths the close's position within the recent high-low range, so it is bounded and reads location. TRIX is unbounded and reads the slope of a filtered trend. Both lean on heavy smoothing; they answer different questions.
Concept family
Momentum & Oscillators
91 concepts mapped · 91 in the Library
TRIX FAQ
Turn TRIX into a trading strategy.
Take the implementation from this page into Quant, then build on it, backtest it on real data, and keep refining it in conversation.