Concept
Cardwell Positive/negative Reversals
Cardwell Positive/negative Reversals are Momentum & Oscillators concepts. The Library holds 1 implementation, a working definition you can pull into Quant.
Top Cardwell Positive/negative Reversals indicator
The top custom implementation, built on the original standard Cardwell Positive/negative Reversals formula.
1 total
Want to trade Cardwell Positive/negative Reversals? The implementation below is one prompt away from a backtested strategy in Quant.
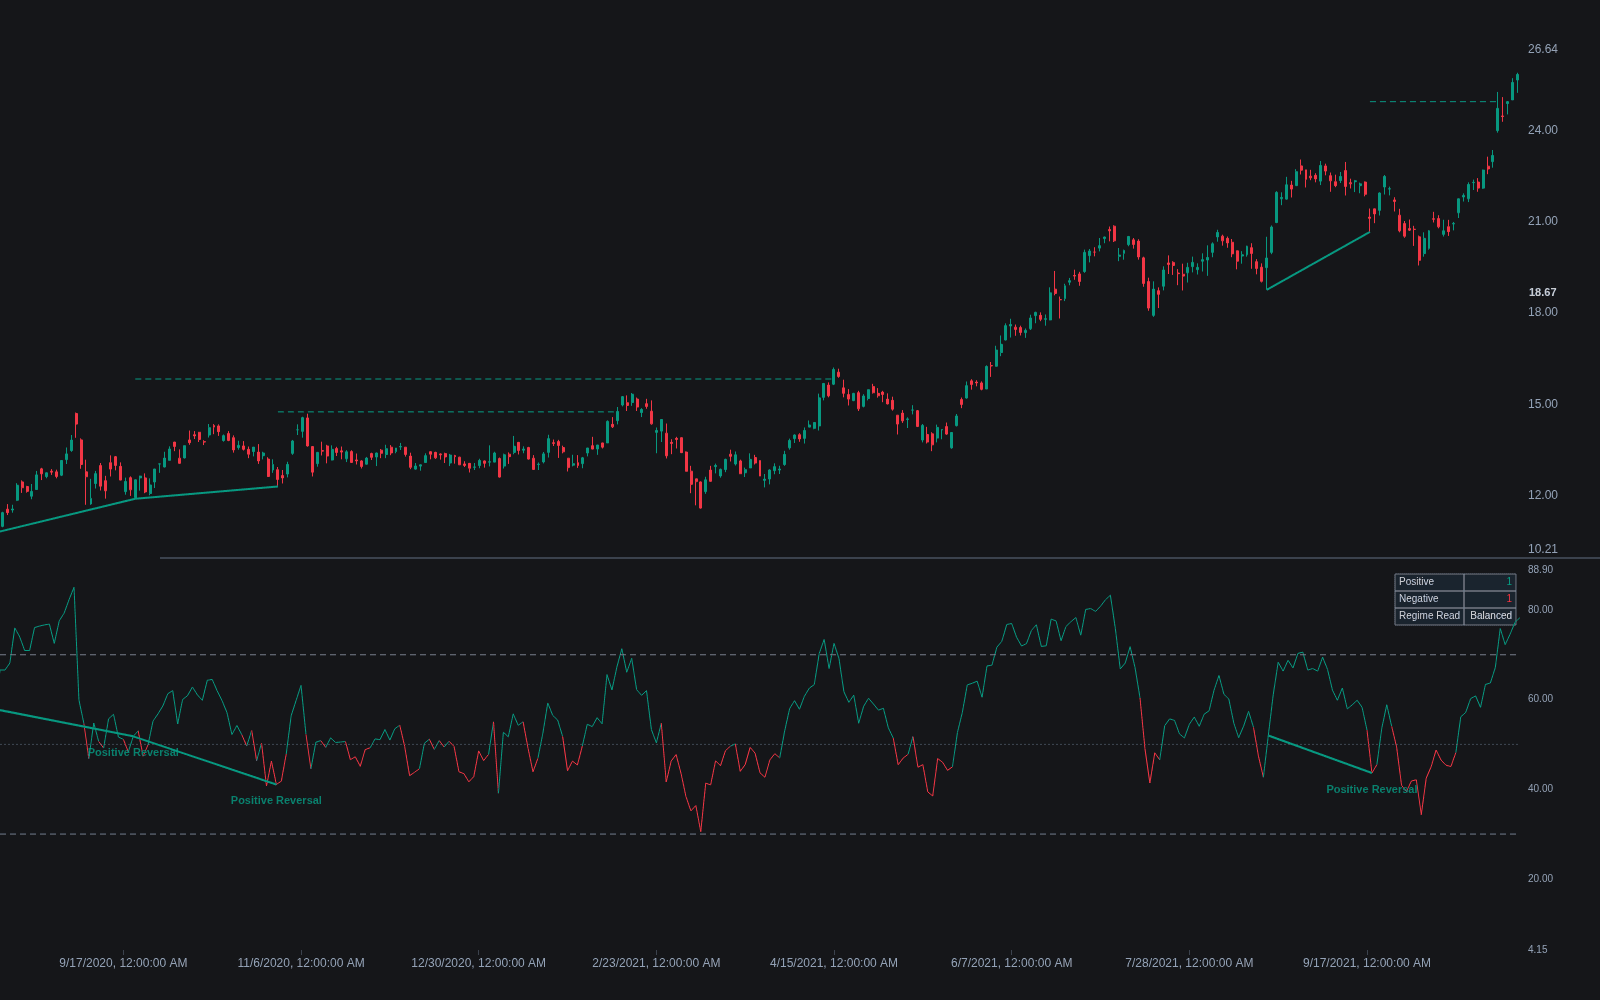
What are Cardwell positive and negative reversals?
Positive and negative reversals are RSI patterns described by Andrew Cardwell, an analyst known for reinterpreting RSI as a trend tool rather than a reversal tool. A positive reversal occurs when RSI makes a lower low while price makes a higher low: momentum looks weaker, yet price holds firmer, and Cardwell reads that as bullish continuation. A negative reversal is the mirror: RSI makes a higher high while price makes a lower high, which he reads as bearish continuation.
The insight is that these patterns are the logical opposite of classic regular divergence. In a regular bearish divergence, price out-performs momentum at a high and the analyst expects reversal. In a negative reversal, momentum out-performs price at a high, and the expectation is that the prevailing downtrend resumes. Cardwell argued that reversals are with-trend signals: positive reversals appear in uptrends, negative reversals in downtrends, and their presence helps confirm which regime the market is in, complementing his shifted-range observations covered under RSI range rules.
Cardwell also attached a price-projection technique to the patterns: measure the price distance traveled during the segment where RSI made its counter-intuitive swing, and project that distance from the breakout point to estimate a minimum objective. Traders care about the whole package because it turns RSI from a fade tool into a trend-following tool with built-in targets, a genuinely different reading of the same indicator most people use for extremes.
How to identify positive and negative reversals
Both patterns compare two successive swing points on price and on RSI. The positive reversal is described; invert for the negative.
- 1Mark two successive swing lows on price during an uptrend or suspected uptrend.
- 2Require price to print a higher low at the second swing.
- 3Require RSI to print a lower low at the corresponding swing, typically from the mid-range rather than from a deep oversold extreme.
- 4Read the combination as bullish: sellers pushed momentum lower but could not push price to a new low.
- 5For a target, measure the price rise from the first RSI low's price to the intervening swing high, and project that amount above the second higher low.
How traders use it
- As trend confirmation: repeated positive reversals mark healthy uptrends, and their appearance argues for buying pullbacks rather than fading strength.
- As a counterweight to divergence signals: when a chart shows both a divergence and a reversal pattern at different swings, Cardwell practitioners weight the reversal, on the argument that reversals side with the trend.
- For price objectives: the measured projection gives a minimum target, which some traders use for scaling out or validating whether a trade offers enough range to be worth taking.
- As a regime cue alongside RSI range analysis: positive reversals plus RSI ranges holding above roughly 40 reinforce a bull-regime read; negative reversals plus capped rallies reinforce a bear regime.
- With realistic limits: swing selection is discretionary, the patterns are only meaningful relative to a correctly identified trend, and no public, rigorous statistics validate the projection technique.
Cardwell reversals vs. divergence concepts
Hidden divergence: Hidden divergence describes the same geometric configurations (price higher low with oscillator lower low, and the bearish mirror) under a different name and framing. Cardwell's treatment adds the with-trend interpretation and the price-projection method.
Regular divergence: Regular divergence has price making the more extreme swing and anticipates reversal. Cardwell reversals have the oscillator making the more extreme swing and anticipate continuation. They are opposite configurations with opposite implications.
RSI failure swing: A failure swing is defined on RSI alone, without reference to price swings, and signals reversal. Cardwell reversals require comparing RSI swings against price swings and signal continuation.
Concept family
Momentum & Oscillators
84 concepts mapped · 84 in the Library
Cardwell Positive/negative Reversals FAQ
Turn Cardwell Positive/negative Reversals into a trading strategy.
Take the implementation from this page into Quant, then build on it, backtest it on real data, and keep refining it in conversation.