Concept
RSI Failure Swing
RSI Failure Swing is a Momentum & Oscillators concept. The Library holds 1 implementation, a working definition you can pull into Quant.
Top RSI Failure Swing indicator
The top custom implementation, built on the original standard RSI Failure Swing formula.
1 total
Want to trade RSI Failure Swing? The implementation below is one prompt away from a backtested strategy in Quant.
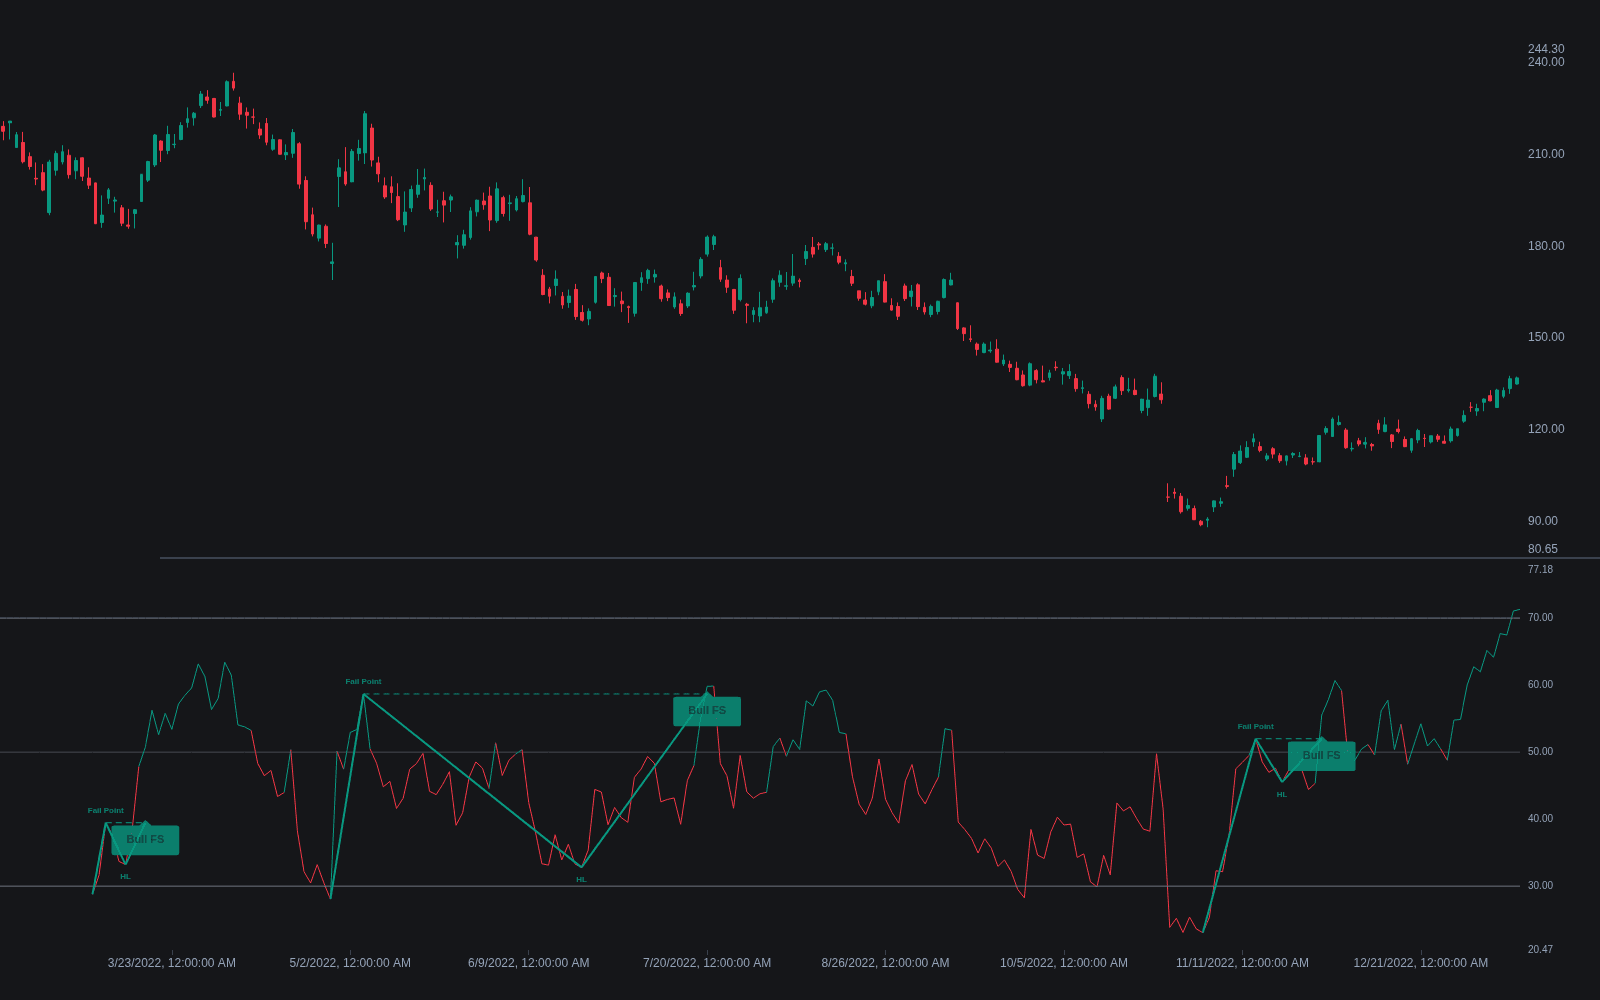
What is an RSI Failure Swing?
An RSI failure swing is the reversal pattern Wilder defined on the RSI line itself, without reference to price. In the common bullish reading, RSI drops below 30 into oversold territory, rebounds to an interim peak (Wilder's fail point), pulls back without taking out its prior low or re-entering oversold, then breaks above that interim peak; the break is the signal. The bearish version mirrors every step above 70: a lower high on RSI after an overbought reading, then a break of the interim trough.
The pattern dates to J. Welles Wilder's 1978 book New Concepts in Technical Trading Systems, the same monograph that introduced RSI itself alongside the Average True Range and the Parabolic SAR. Wilder rated failure swings above 70 or below 30 as very strong indications of a market reversal, and he demonstrated them on the 14-period daily RSI he recommended throughout the book. Later literature kept his two variants: the failure swing bottom for the bullish case and the failure swing top for the bearish one.
The logic is a structure break on momentum: the oscillator prints a higher low and then confirms it, often before price structure does the same. The pattern is also self-contained on RSI, which separates it from divergence, a comparison that needs both series; a failure swing can complete without price and the indicator ever disagreeing. Like any reversal pattern they fail regularly in strong trends, where oversold simply stays oversold and the fail point never breaks.
Two details in the definition do real work. The excursion beyond 30 or 70 certifies that momentum reached a genuine extreme before turning; a higher low formed entirely mid-range is ordinary chop, not a failure swing. The fail-point break is the confirmation step: plenty of oscillator higher lows dissolve into fresh weakness, and waiting for the break filters some of them at the cost of a later entry. Nothing in the pattern measures how far the resulting move should carry, so targets and stops are keyed to price structure rather than to the oscillator that produced the signal.
How to identify an RSI failure swing
Steps for the bullish (bottom) version using Wilder's 70/30 bands on a 14-period RSI; the bearish version mirrors each step above 70.
- 1RSI falls below 30, registering an oversold reading.
- 2RSI rebounds back above 30 to an interim peak, the fail point, then rolls over again.
- 3The pullback bottoms above the prior RSI low, and in the common reading stays above 30: the oscillator has printed a higher low.
- 4RSI breaks above the fail point. That break completes the failure swing and is the traditional trigger, usually paired with a stop beneath the corresponding price swing low.
How it's calculated
A reversal signal defined on RSI alone: the oscillator fails to extend past its prior extreme and then breaks its own interim swing point.
Wilder defined failure swings on RSI alone, without requiring price divergence, though many traders look for both together.
Thresholds 30 and 70 are the standard defaults; tightening them to 20 and 80 yields fewer, later swings.
Platforms that smooth RSI with a plain EMA instead of Wilder's RMA place the swing points slightly differently.
How traders use it
- As a standalone momentum-structure trigger: the fail-point break is traded directly on the timeframe's RSI, with risk keyed to the price swing rather than to the oscillator.
- As confirmation alongside divergence: a failure swing that completes while price and RSI diverge is the classic two-part reversal case, each read covering the other's blind spot.
- As an exit or tightening cue: a bearish failure swing forming after an extended advance is treated as a warning to protect profits even while price structure remains intact.
- As a cross-oscillator template: traders apply the same swing logic to the stochastic oscillator or CCI, though each oscillator needs its own extreme levels rather than Wilder's 30/70.
- On derived inputs: because the pattern needs no price reference, it transfers unchanged to RSI of other sources and to adaptive RSI variants, where the same higher-low-plus-break structure is read on the derived line.
RSI Failure Swing vs similar concepts
Regular Bullish/bearish Divergence: Divergence is a disagreement between price extremes and RSI extremes across two swings, so it needs both series. A failure swing is self-contained on RSI: higher low plus fail-point break. They frequently coincide at turns, and many playbooks want both before acting.
Hidden Divergence: Hidden divergence is a continuation read: price holds a higher low while RSI prints a lower low, arguing the trend resumes. A failure swing is a reversal read built from RSI's own swings, and in a pullback the two can appear near the same bars with opposite messages.
Overbought/oversold: A raw overbought or oversold tag treats the 70/30 touch itself as the event. A failure swing demands more: the extreme, a bounce, a held higher low, and a confirming break. It upgrades the threshold signal into a structural one, trading frequency for evidence.
Concept family
Momentum & Oscillators
91 concepts mapped · 91 in the Library
RSI Failure Swing FAQ
Turn RSI Failure Swing into a trading strategy.
Take the implementation from this page into Quant, then build on it, backtest it on real data, and keep refining it in conversation.