Concept
Pretty Good Oscillator
Pretty Good Oscillator is a Momentum & Oscillators concept. The Library holds 1 implementation, a working definition you can pull into Quant.
Top Pretty Good Oscillator indicator
The top custom implementation, built on the original standard Pretty Good Oscillator formula.
1 total
This Pretty Good Oscillator implementation is strategy-ready: open it in Quant, set your rules, and it backtests automatically.
What is the Pretty Good Oscillator?
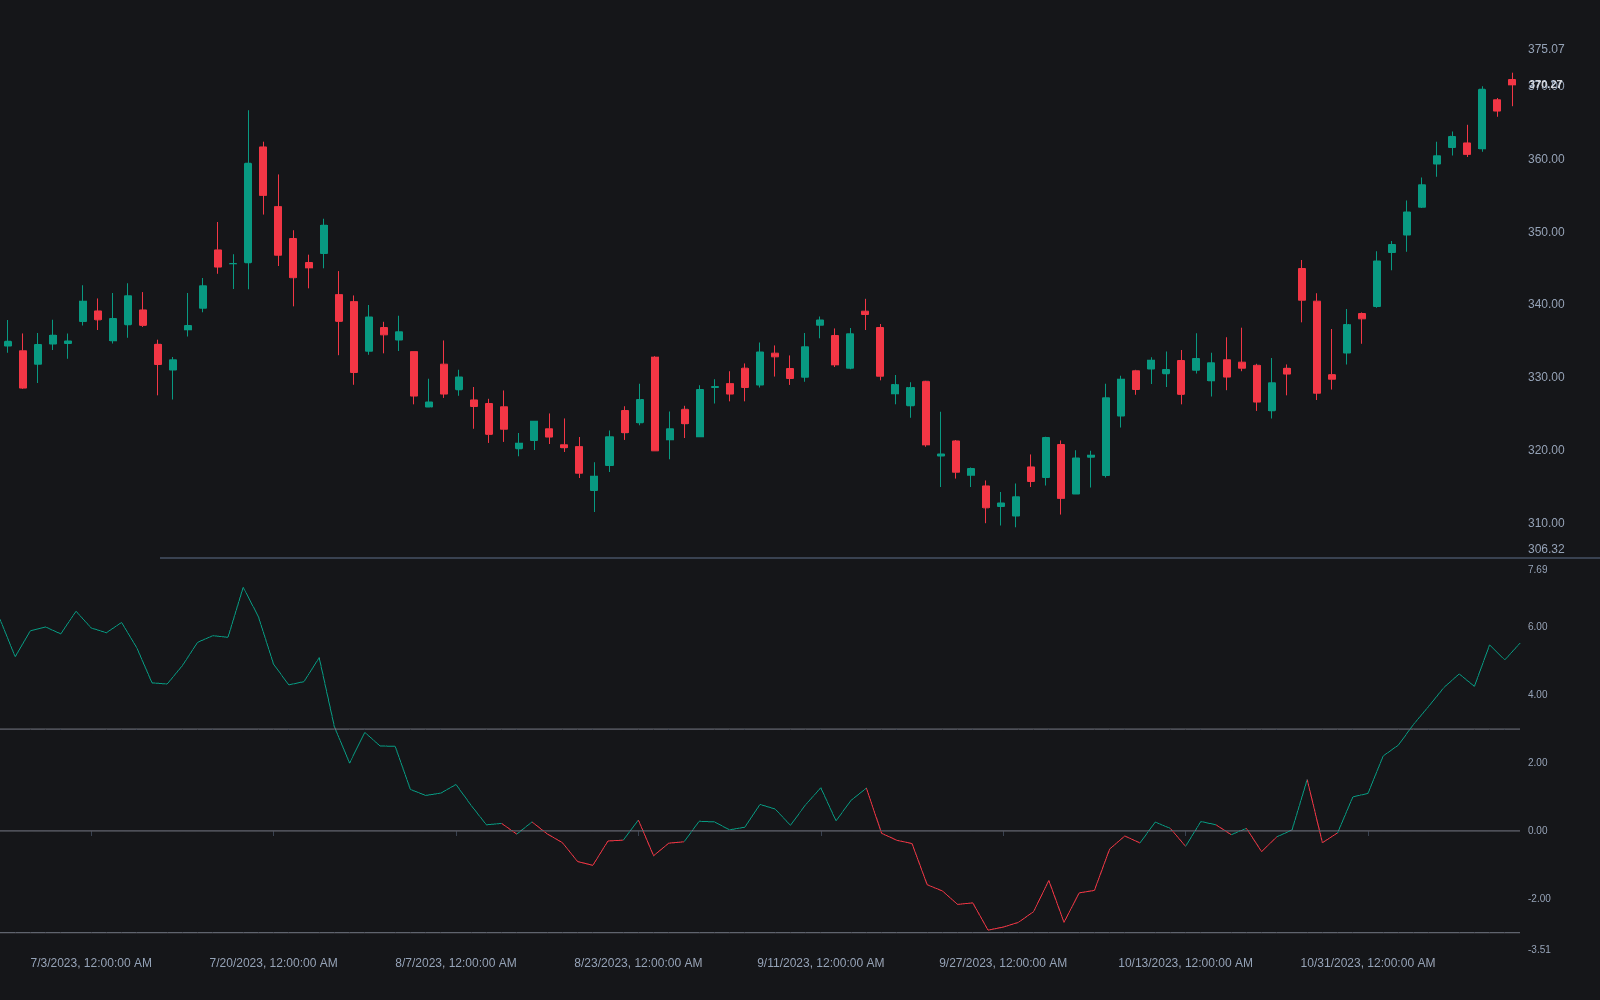
The Pretty Good Oscillator (PGO) measures how far the close sits from its moving average, expressed in units of average true range. The construction is deliberately plain: subtract an N-period simple moving average of the close from the current close, then divide by an N-period exponential average of the true range. The result reads like a volatility-adjusted distance score: a PGO of +3 means price closed roughly three average-true-range units above its own baseline. The indicator is commonly credited to Mark Johnson, who described it as a breakout tool and, in his own self-deprecating phrase, merely a pretty good one.
The design solves a real comparability problem. Raw distance from a moving average is denominated in price, so a 5-point stretch means something entirely different on a quiet instrument than on a wild one. Dividing by a true-range average normalizes the stretch, making thresholds portable across instruments and across volatility regimes on the same instrument.
PGO is unbounded, so it has no fixed overbought or oversold ceiling; extreme readings mark unusual extension, which breakout traders read as strength and mean-reversion traders read as stretch. That dual reading is the honest core of the tool: the number describes displacement, and the trader supplies the interpretation.
How it's calculated
PGO is the close's displacement from its simple moving average, scaled by smoothed true range.
Some implementations use a simple rather than exponential average of true range in the denominator; readings differ modestly.
The output is unbounded and centered on zero, positive when price is above its baseline.
How traders use it
- As a breakout trigger in the original style: go long when PGO pushes above +3.0, short below -3.0, and exit as it returns through zero, on the logic that a three-unit displacement in true-range terms signals genuine initiative rather than noise.
- As a mean-reversion stretch gauge with the thresholds inverted: some traders fade extreme readings on range-bound instruments, accepting that the same number that marks a breakout on one market marks exhaustion on another.
- As a volatility-normalized filter over other signals, for example only taking breakout entries when PGO confirms the close is meaningfully displaced rather than poking marginally past a level.
- For cross-instrument screening, since the true-range denominator makes a +2.5 reading roughly comparable between a currency pair and an index future in a way raw MA distance never is.
- With its limits in view: PGO knows nothing about structure or volume, whipsaws around its thresholds in transitional regimes, and a zero-line exit gives back a large share of trend profits by construction.
Pretty Good Oscillator vs adjacent measures
Z-score: A z-score divides the same displacement by the standard deviation of price. PGO divides by average true range instead, so gaps and intrabar extremes feed the denominator and the reading behaves differently when volatility shows up between closes.
Disparity index: The disparity index expresses distance from the moving average as a percentage of the average. That normalizes for price level but not for volatility; PGO's true-range scaling handles both.
Keltner Channels: Keltner Channels draw ATR-multiple bands around an average on the price panel; PGO is essentially the same measurement plotted as a single oscillator line, with thresholds standing in for band touches.
Concept family
Momentum & Oscillators
91 concepts mapped · 91 in the Library
Pretty Good Oscillator FAQ
Turn Pretty Good Oscillator into a trading strategy.
Take the implementation from this page into Quant, then build on it, backtest it on real data, and keep refining it in conversation.