Concept
Qstick
Qstick is a Momentum & Oscillators concept. The Library holds 1 implementation, a working definition you can pull into Quant.
Top Qstick indicator
The top custom implementation, built on the original standard Qstick formula.
1 total
From studying Qstick to trading it: take the implementation below into Quant and backtest it instantly.
What is Qstick?
Qstick is Tushar Chande's candle-body average: a simple moving average of close minus open over a short lookback. The name reflects its purpose, quantifying candlesticks: instead of eyeballing whether recent candles are mostly bullish or bearish bodies, Qstick collapses the bodies into one line. Above zero, closes have on balance been above opens, net buying during the bar; below zero, the reverse. Gaps between bars are ignored entirely, and there is no universal default length, though short lookbacks such as 8 bars are common in published examples.
Chande presented Qstick in The New Technical Trader (1994), the book he co-authored with Stanley Kroll that also covered VIDYA and other indicators. The premise borrows from Japanese candlestick reading: the body, open to close, is where a session's directional conviction lives, while the wicks record excursions that failed to hold. Averaging the bodies turns that qualitative candle judgment into a plottable momentum line.
It reads as a simple bias line. The zero cross marks the flip between net-bullish and net-bearish bodies, unusually high or low readings mark one-sided stretches, and divergence against price warns that a trend's candles are hollowing out even as price extends. Because Qstick is unbounded and scales with the instrument's price, its extremes have no fixed thresholds; they are judged against that market's own history.
What distinguishes Qstick from most momentum tools is the differencing it uses. ROC and the classic momentum line compare closes across bars, so overnight gaps flow straight into them; Qstick compares each bar's close with its own open, isolating intrabar pressure. Related body-based measures make other choices: Balance of Power divides each body by its bar's high-low range, so every bar contributes a normalized score and a single wide-range bar that would move Qstick substantially barely registers there; the Intraday Momentum Index feeds the same bodies through an RSI-style ratio, producing a bounded 0-100 line with overbought and oversold bands. Qstick keeps raw, price-scaled bodies, which preserves magnitude but makes cross-market comparison meaningless.
How to identify Qstick signals on a chart
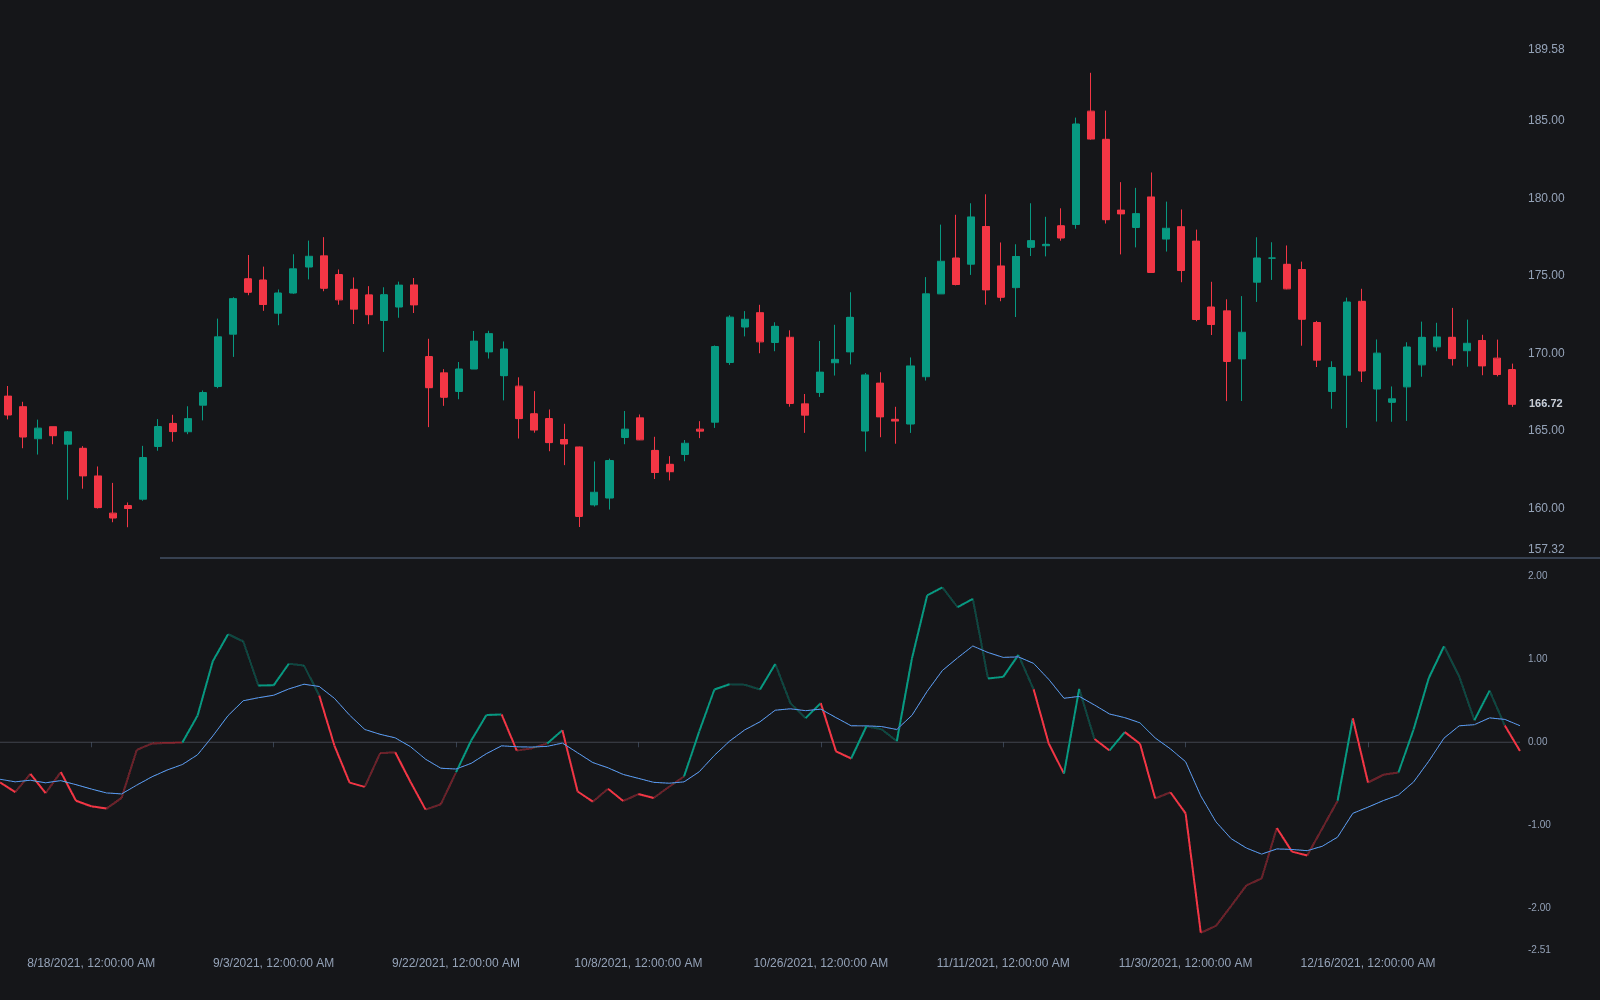
Qstick plots in a lower pane as a single line oscillating around zero, sometimes with a moving-average signal line added on top.
- 1Add a Qstick or candle-body-momentum indicator and set the lookback; around 8 bars is the common short setting, while longer lookbacks smooth it into a bias filter.
- 2Locate the zero line: readings above it mean recent candles have mostly closed above their opens, readings below mean the opposite.
- 3Compare the line's level with its own recent history to judge stretch, since Qstick has no fixed overbought or oversold bounds.
- 4Check the candles themselves when the line rolls over: shrinking bodies at new price highs are the pattern behind most of its warnings.
- 5If a signal line is plotted, note crossings between Qstick and its average as the faster trigger.
How traders use it
- Zero-line crosses as a body-bias trigger: a cross above zero after a stretch of net-bearish candles says intrabar buying has taken over; some implementations add a moving-average signal line on Qstick for earlier crossovers, echoing the MACD signal-line convention.
- As candlestick confirmation: a bullish reversal pattern carries more weight when Qstick is already rising or above zero, because the average body agrees with the pattern's story.
- As a divergence check: price pressing to new highs while Qstick fades toward zero shows shrinking bullish bodies, the same caution read other momentum divergences give.
- In gap-prone markets as a cross-check: when close-to-close momentum is strong but Qstick stays flat, the advance is living on gaps rather than intrabar buying, a distinction session traders care about.
- As a higher-timeframe trend filter: a weekly Qstick holding one side of zero sets the bias within which faster signals from a Stochastic Oscillator or similar tool are taken.
Qstick vs other momentum measures
Momentum: The classic momentum line is close minus the close N bars ago, one differencing across bars; Qstick averages close minus open within each bar. Momentum captures everything including gaps and drift, Qstick captures only what happened between a bar's open and its close.
ROC: ROC expresses close-to-close change as a percentage, making it comparable across instruments. Qstick stays in raw price units of body size, so its scale is instrument-specific, but it isolates the intrabar direction that ROC blends together with overnight moves.
RSI: RSI feeds close-to-close changes through a gain/loss ratio into a bounded 0-100 scale with conventional 30/70 bands. Qstick is unbounded around zero with no standard bands, trading RSI's comparability for a direct reading of candle bodies.
Concept family
Momentum & Oscillators
91 concepts mapped · 91 in the Library
Qstick FAQ
Turn Qstick into a trading strategy.
Take the implementation from this page into Quant, then build on it, backtest it on real data, and keep refining it in conversation.