Concept
Awesome Oscillator
Awesome Oscillator is a Momentum & Oscillators concept. The Library holds 1 implementation, a working definition you can pull into Quant.
The standard Awesome Oscillator indicator
Awesome Oscillator exactly as classically defined: the faithful reference build of the original formula, free to run in Quant.
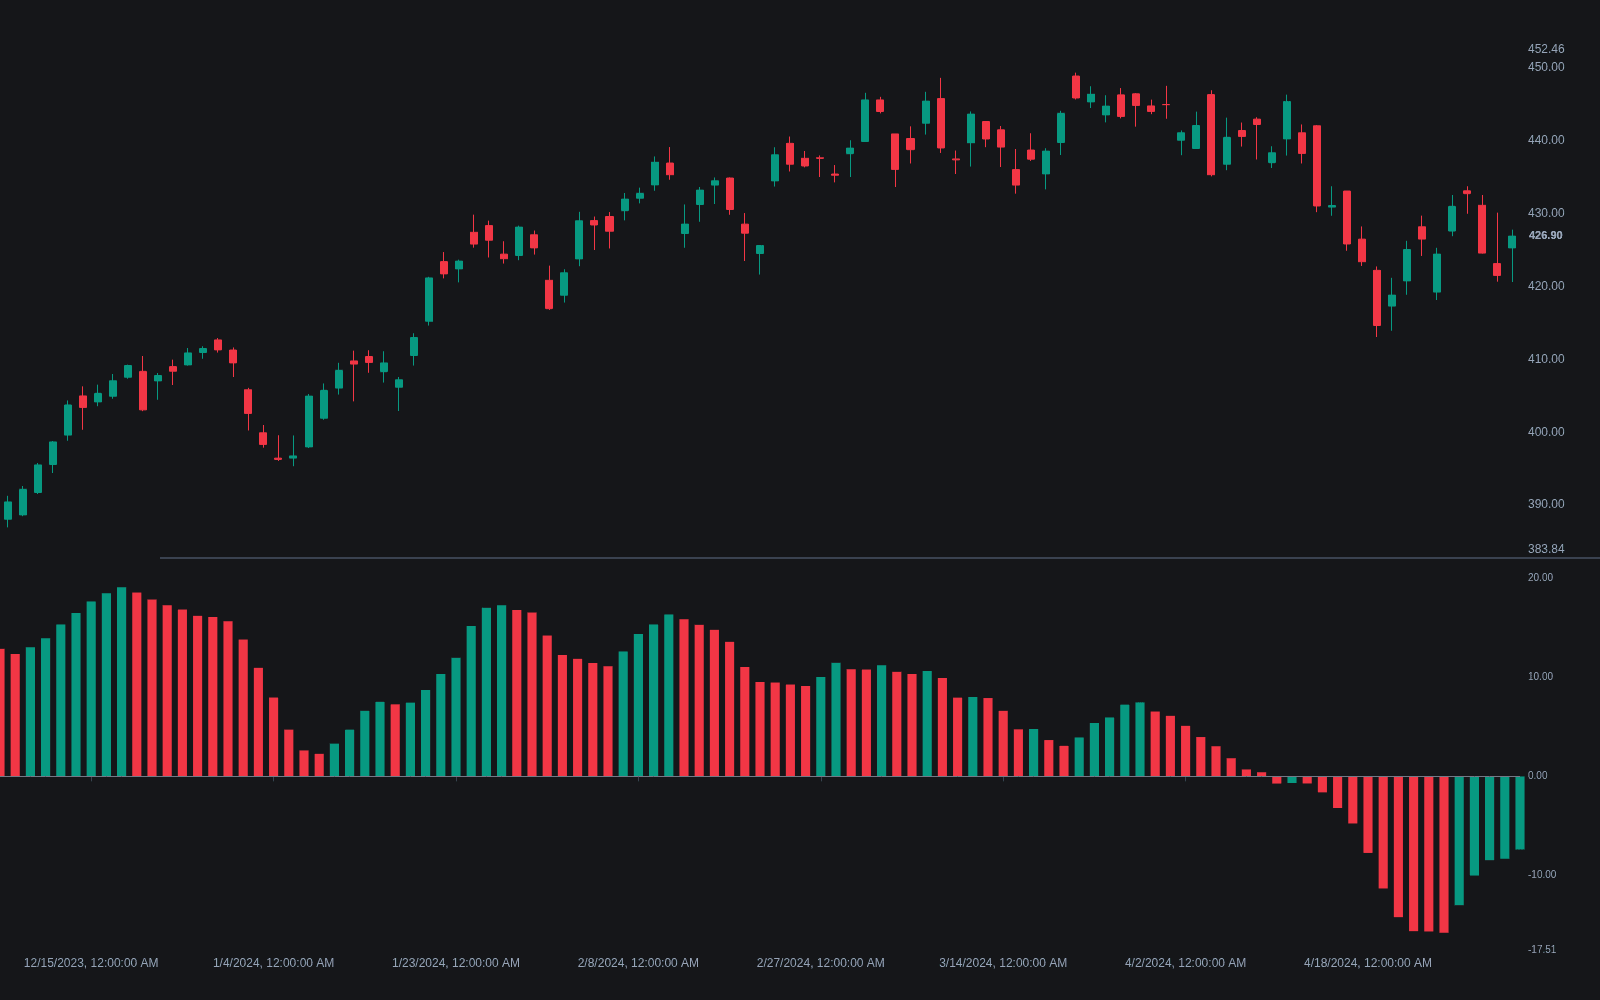
What is the Awesome Oscillator?
The Awesome Oscillator (AO) is Bill Williams' momentum histogram: a 5-period simple moving average of the bar midpoint (high plus low, halved) minus a 34-period SMA of the same midpoint. The parameters are fixed by design; Williams specified 5/34 on median price within his Chaos framework, where AO runs alongside the Alligator and fractal signals. Each histogram bar is colored by whether it rose or fell versus the prior bar, and that bar-to-bar change carries much of the signal meaning.
Reading it is a two-layer exercise: the zero line splits the momentum regime (short average above long is bullish, below is bearish), while color changes track acceleration within the regime. Williams defined three named entries on this base: the zero-line cross, the saucer, and twin peaks. The same construction, give or take a period, underlies the 5/35 Oscillator used in Elliott wave counting, so AO also serves as a rough wave-strength gauge. Being unbounded, it has no fixed overbought level; extremes are judged relative to recent history.
How to read the Awesome Oscillator
AO's named signals all come from the histogram's position relative to zero and its bar-to-bar direction.
- 1Zero-line cross: the histogram moving from negative to positive shifts the momentum regime bullish (and vice versa); it is the simplest and slowest of the named signals.
- 2Saucer (bullish case): with the histogram above zero, two consecutive falling bars followed by a rising bar form the saucer, a dip-and-resume pattern within an uptrend. The bearish mirror forms below zero.
- 3Twin peaks (bullish case): entirely below zero, a trough, a bounce that stays below zero, then a shallower trough followed by a rising bar; if the histogram crosses zero between the troughs, the count resets.
- 4Divergence: price making a new extreme while AO makes a lesser one reads like any regular divergence, a warning that thrust is fading rather than a standalone reversal signal.
How it's calculated
Momentum histogram equal to the difference between a fast and a slow simple moving average of the bar's median price.
Defined by Bill Williams with fixed 5/34 lengths; platforms rarely expose them as inputs.
Plotted as a histogram around zero, colored by bar-to-bar change; zero-line crosses, saucers, and twin peaks are the classic readings.
The related Accelerator Oscillator is AO_t - SMA_5(AO)_t.
How traders use it
- As the momentum leg of Williams' Chaos system, where AO signals are taken in agreement with the Alligator's trend read and fractal breakouts rather than in isolation.
- As a wave-strength gauge in Elliott-style analysis: in that tradition the strongest AO extreme accompanies the third wave, and a weaker peak on a fifth-wave price high is the classic exhaustion tell.
- As a blunt regime filter: longs only while the histogram is above zero, shorts only below, keeping faster signals pointed with medium-term momentum.
- As a divergence scanner on swing highs and lows, where the fixed 5/34 parameters make readings comparable across symbols and timeframes.
Awesome Oscillator vs. similar oscillators
MACD: MACD subtracts EMAs of the close and adds a signal line; AO subtracts SMAs of the bar midpoint and reads bar-to-bar color changes instead. AO's histogram is a momentum reading, while the MACD histogram measures the MACD line against its own average.
5/35 Oscillator: Nearly the same arithmetic (5 versus 34 or 35 period averages), different tradition: AO belongs to Williams' Chaos framework with named saucer and twin-peaks signals, while the 5/35 is read through Elliott wave counts.
Accelerator Oscillator: The Accelerator Oscillator is AO minus a 5-period SMA of AO, so it measures the change in AO rather than momentum itself, typically turning earlier and whipsawing more.
Concept family
Momentum & Oscillators
91 concepts mapped · 91 in the Library
Awesome Oscillator FAQ
Turn Awesome Oscillator into a trading strategy.
Take the implementation from this page into Quant, then build on it, backtest it on real data, and keep refining it in conversation.