Concept
Relative Momentum Index
Relative Momentum Index is a Momentum & Oscillators concept. The Library holds 1 implementation, a working definition you can pull into Quant.
RMI
Top Relative Momentum Index indicator
The top custom implementation, built on the original standard Relative Momentum Index formula.
1 total
Want to trade Relative Momentum Index? The implementation below is one prompt away from a backtested strategy in Quant.
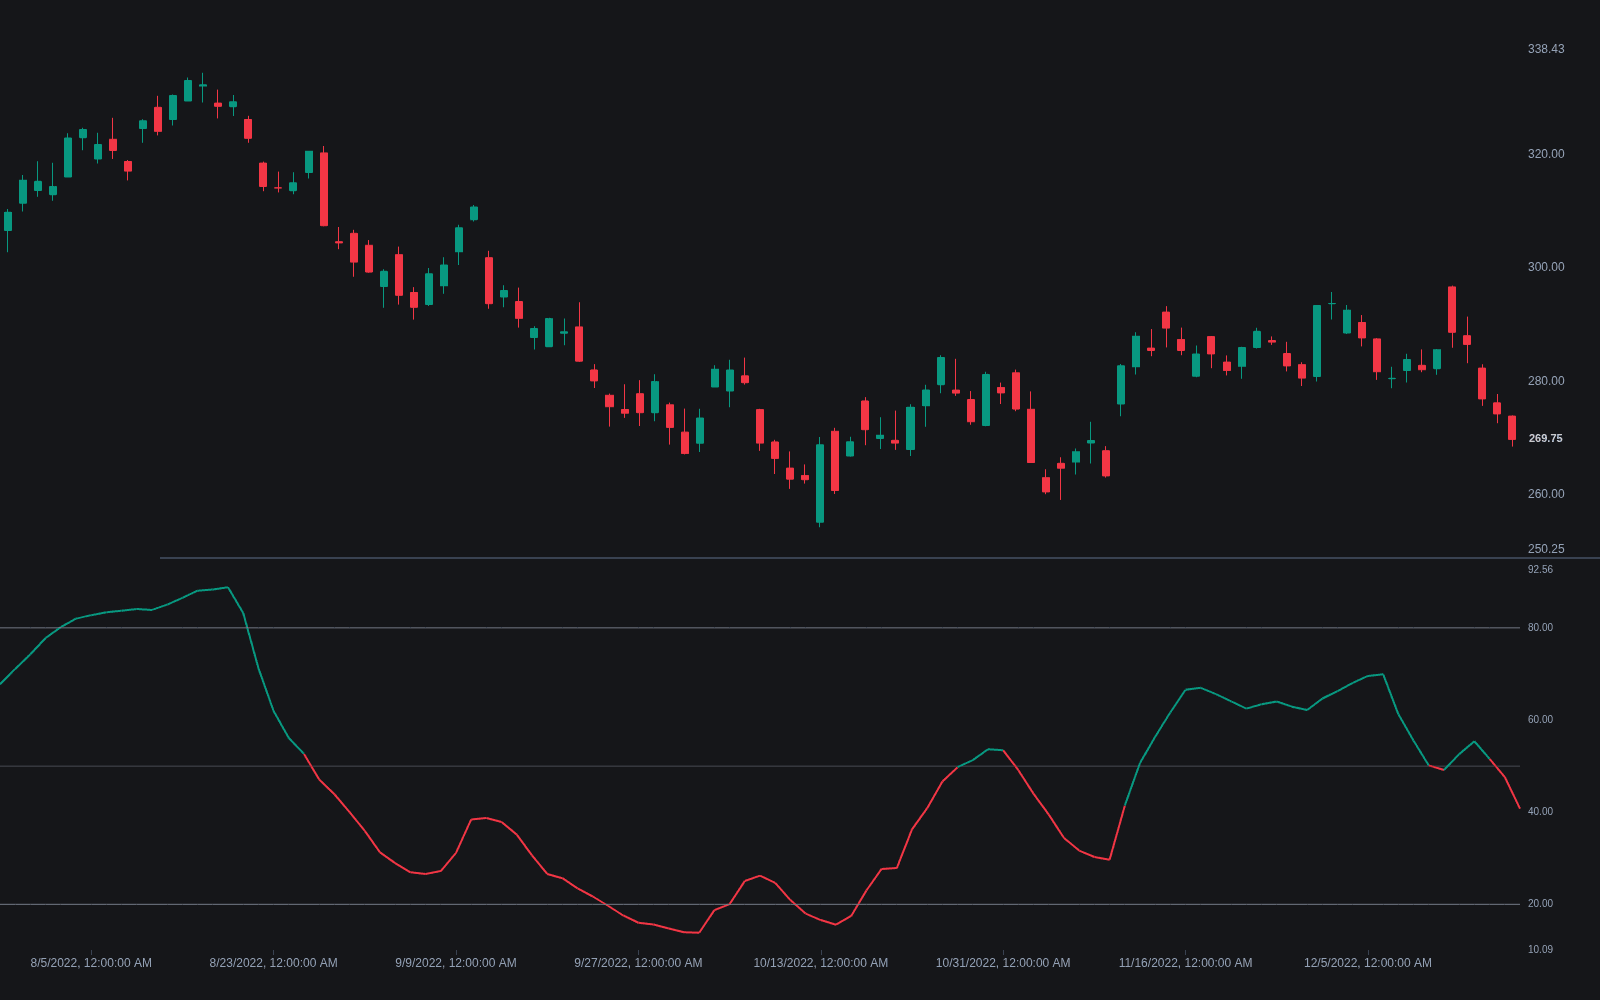
What is the Relative Momentum Index?
The Relative Momentum Index is Roger Altman's 1993 modification of RSI. Where RSI measures each up or down change from one close to the next, RMI measures the change against the close a set number of bars back (the momentum step), then applies the same Wilder-style smoothing and 0-100 scaling. With the momentum step set to 1, RMI is identical to RSI; with a step of several bars, each reading captures multi-bar momentum rather than single-bar noise.
Altman introduced the index in a 1993 Technical Analysis of Stocks & Commodities article, aiming at a specific complaint: on choppy data, RSI's bar-to-bar changes wash out into a mid-range wiggle that rarely reaches its own extreme zones. Substituting a multi-bar momentum step made the up-and-down components larger and more persistent, restoring the decisive swings that threshold-based reading needs.
The practical effect is a smoother oscillator that swings more decisively between extremes. Multi-bar changes tend to be larger and more persistent than bar-to-bar changes, so RMI spends more time in its overbought and oversold zones and crosses thresholds with fewer whipsaws, at the cost of added lag. There is no single standard setting: published examples pair a longer smoothing length with a momentum step of several bars, and platform defaults vary.
Reading it is RSI grammar with recalibrated constants. Because the line visits extremes more readily, the classic 70/30 bands mark less exceptional conditions than they do on RSI, and many users widen them or define extremes by the instrument's own reading history instead. Divergence work carries over directly, with the multi-bar basis filtering some of the minor swings that clutter RSI pivots, and the same trend caveat applies: in a strong move, extreme readings are a feature of the trend, not a fade invitation.
How to read the Relative Momentum Index
RMI plots 0-100 in its own pane; the reading is RSI practice adjusted for wider swings.
- 1Add the indicator and note both settings: the smoothing lookback and the momentum step (a step of 1 collapses it into RSI).
- 2Expect wider travel: with multi-bar steps the line reaches extreme zones more often, so thresholds calibrated for RSI mark commoner conditions here.
- 3Set extreme bands from the instrument's own history, wider than 70/30 as a rule, or defined by the reading's own percentiles.
- 4Read divergences on confirmed pivots exactly as with RSI, using the smoother line to skip the marginal swings.
- 5Gate signals by trend context: extreme readings inside strong trends are persistence, not reversal setups, the same discipline every bounded oscillator demands.
How it's calculated
An RSI variant that measures price change over a multi-bar momentum lookback instead of one bar, yielding a smoother 0 to 100 oscillator.
Published by Roger Altman (1993); with m = 1 it reduces exactly to Wilder's RSI.
The first AvgUp and AvgDn are seeded with a simple average of the first n values, as in RSI; some platforms use an EMA instead of Wilder smoothing.
Typical overbought and oversold thresholds are 70/30 or 80/20.
How traders use it
- For overbought/oversold timing with RSI-style thresholds. The smoother line tags extreme zones more decisively, though an extreme reading is a condition to watch, not a reversal signal by itself.
- For divergence: the same regular bullish and bearish divergence reads used on RSI apply, with RMI's multi-bar basis filtering out some of the minor swings that clutter RSI divergence.
- As a drop-in replacement for RSI inside existing rules when single-bar noise causes too many threshold whipsaws; the substitution changes signal frequency, so thresholds usually need retuning.
- As a smoother divergence engine in confluence stacks: pairing RMI with a differently built oscillator such as MACD or the stochastic oscillator applies the standard rule that agreement between unlike constructions outranks either alone.
- As a template: the step trick generalizes, and the same substitution of multi-bar for single-bar change underlies other refinements in the family, the way RSI of other sources generalizes RSI's input rather than its step.
RMI vs neighboring oscillators
RSI: The parent: identical smoothing and scaling, with the momentum step as the only difference. Step 1 reproduces RSI exactly; larger steps trade responsiveness for decisive swings that actually reach the extreme zones.
Momentum: Raw momentum is the unprocessed multi-bar change: unbounded, unsmoothed, in price units. RMI feeds that same quantity through Wilder averaging into a bounded 0-100 line, exchanging magnitude information for comparability and thresholds.
Stochastic Momentum Index: The SMI refines the stochastic by measuring the close against the range midpoint with double smoothing; RMI refines RSI by lengthening the change interval. Both chase smoother, more readable oscillators from different parents.
Concept family
Momentum & Oscillators
91 concepts mapped · 91 in the Library
Relative Momentum Index FAQ
Turn Relative Momentum Index into a trading strategy.
Take the implementation from this page into Quant, then build on it, backtest it on real data, and keep refining it in conversation.