Concept
Embedded Readings
Embedded Readings are Momentum & Oscillators concepts. The Library holds 1 implementation, a working definition you can pull into Quant.
pinned OB/OS in strong trends
Top Embedded Readings indicator
The top custom implementation, built on the original standard Embedded Readings formula.
1 total
Want to trade Embedded Readings? The implementation below is one prompt away from a backtested strategy in Quant.
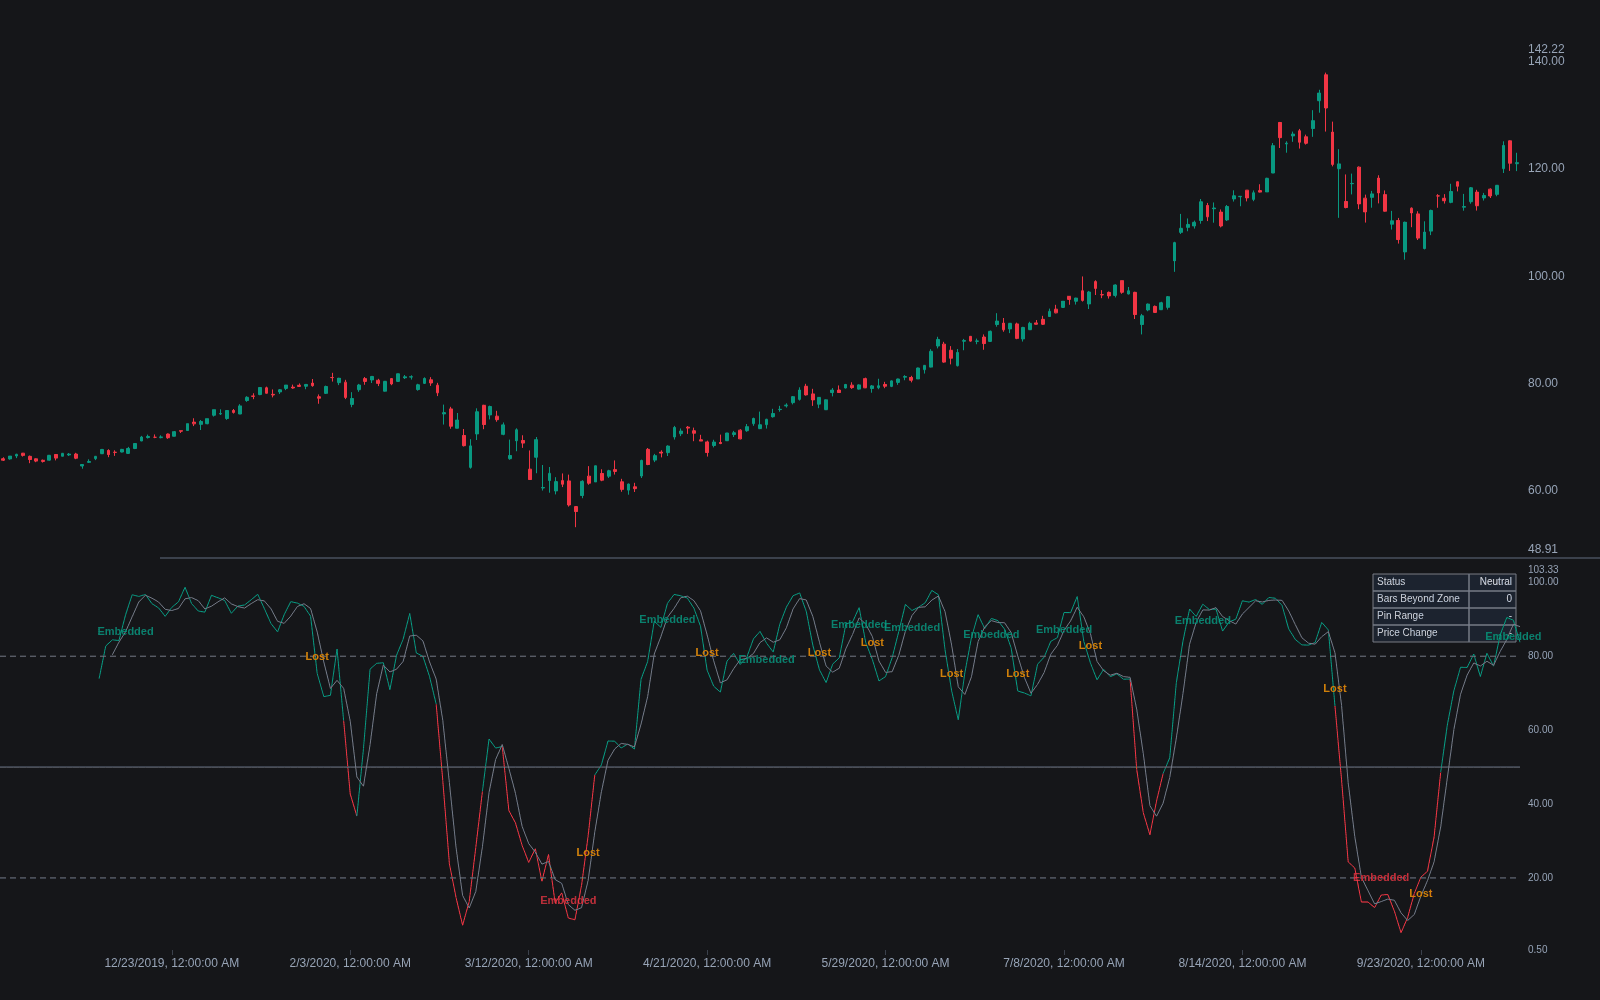
What are embedded readings?
An embedded reading occurs when a bounded oscillator becomes pinned in its overbought or oversold zone and stays there bar after bar while a strong trend runs. Instead of oscillating, the indicator flattens near its extreme: a Stochastic Oscillator holding above 80 through a sustained advance, or RSI camped above 70, are the classic examples. The term is most associated with stochastics, where some practitioners use a working rule that roughly three consecutive closes of both %K and %D beyond the threshold mark the oscillator as embedded.
The concept exists to fix the most common oscillator mistake: treating every extreme reading as a reversal signal. In a genuine trend, overbought and oversold labels invert their meaning. A momentum gauge that is pinned is reporting persistent strength, not imminent exhaustion, and fading it repeatedly tends to bleed capital quickly in a trending market.
Traders care because embedding is a regime flag. Once an oscillator is embedded, the standard playbook flips: extreme readings are read as trend confirmation, reversal signals from that oscillator are suspended, and the eventual loss of embedding (the oscillator finally dropping back out of the zone) becomes the first meaningful caution sign. The behavior is the oscillator-panel cousin of a band walk along Bollinger Bands, and it tends to coincide with high trend-strength readings on tools like the ADX/DMI system.
How to identify an embedded oscillator
Embedding is defined on the oscillator panel and confirmed by price behavior.
- 1Watch for the oscillator to close beyond its extreme threshold (commonly 80/20 for stochastics, 70/30 for RSI) for several consecutive bars; roughly three is a common working rule for stochastics.
- 2Check that the line has flattened near the extreme rather than spiking and turning; a pinned, low-amplitude plot is the signature.
- 3Confirm price is trending persistently in the same direction, with shallow pullbacks that fail to pull the oscillator out of the zone.
- 4Treat the first decisive close back inside the normal range as the loss of embedding; that is a caution flag, not by itself a reversal signal.
How traders use it
- As a signal filter: while an oscillator is embedded, traders suspend its reversal signals and stop counter-trend entries based on that indicator alone.
- As trend confirmation: embedding is evidence the move is impulsive rather than corrective, supporting trend-following entries on shallow pullbacks.
- As an exit-timing aid: the loss of embedding often precedes deeper corrections, so trend traders use it to tighten stops or take partial profits rather than to reverse position.
- Alongside RSI range analysis: embedded RSI readings are the extreme end of the bull-range and bear-range behavior described in RSI range rules.
- With honesty about lag: by the time embedding is confirmed, a large part of the move has usually happened, and losing embedding can occur mid-trend during a routine consolidation. It classifies regimes; it does not time entries precisely.
Embedded readings vs. related behavior
Overbought/oversold: A single extreme reading says momentum is stretched right now. An embedded reading is a sequence of extremes that reclassifies the environment as trending, flipping the interpretation from reversal-risk to strength.
Band walk: A band walk is the same persistence phenomenon expressed on price bands: repeated closes along the upper or lower Bollinger Band. Embedding is the oscillator-panel version, and the two frequently occur together.
RSI range rules: Range rules describe the shifted zones RSI occupies in bull and bear markets. Embedding is the extreme case where the oscillator does not just shift its range but pins at the boundary.
Concept family
Momentum & Oscillators
91 concepts mapped · 91 in the Library
Embedded Readings FAQ
Turn Embedded Readings into a trading strategy.
Take the implementation from this page into Quant, then build on it, backtest it on real data, and keep refining it in conversation.