Concept
Volume Oscillator
Volume Oscillator is a Volume & Order Flow concept. The Library holds 1 implementation, a working definition you can pull into Quant.
The standard Volume Oscillator indicator
Volume Oscillator exactly as classically defined: the faithful reference build of the original formula, free to run in Quant.
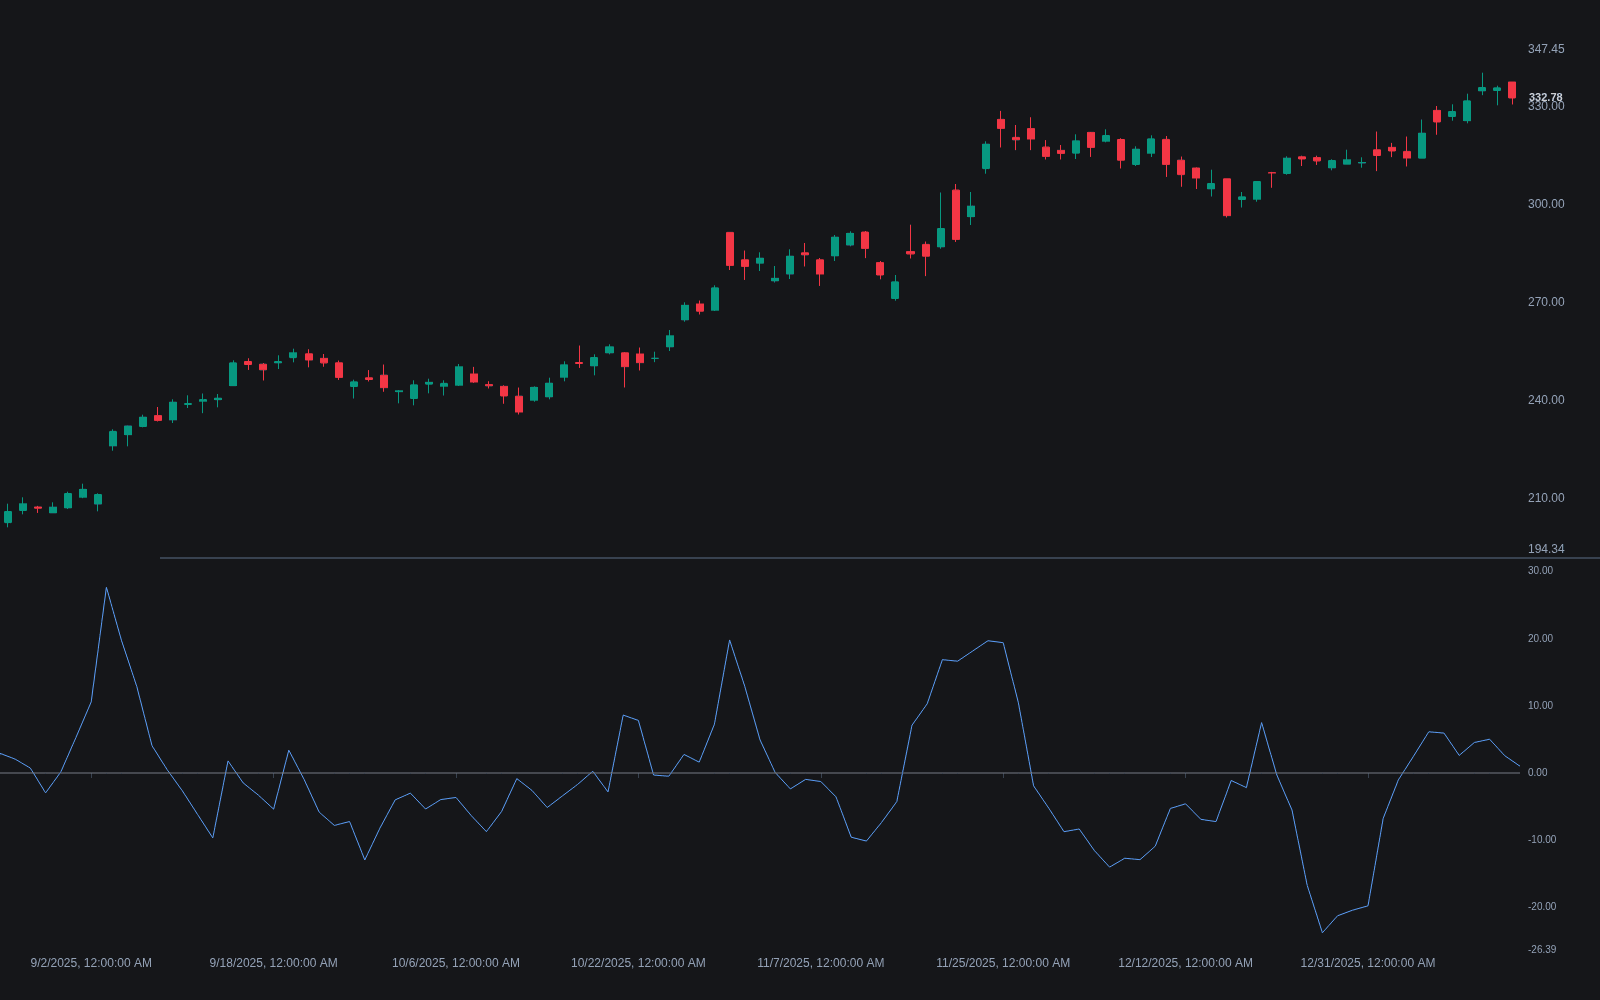
What is the Volume Oscillator?
The Volume Oscillator measures whether trading activity is expanding or contracting. It takes two moving averages of volume, one fast and one slow, and plots the difference between them, most often as a percentage of the slow average. Positive readings mean recent volume is running above its longer-term baseline; negative readings mean it is running below. The percentage form is the volume analogue of the PPO: the same construction, applied to volume instead of price.
No single author owns the construction: differencing a fast and slow average is the oldest oscillator recipe in the toolbox, and applying it to volume appeared across charting platforms as standard equipment rather than through one published paper. Variants add MACD-style furniture, a signal line, a histogram, without changing the substance: the reading is always current activity measured against its own recent baseline.
On its own the oscillator says nothing about direction. Volume expands during breakouts, trend legs, and liquidations alike, so the reading works as a participation gauge to set against price action: the same price move means different things on expanding volume than on contracting volume. It also differs from relative volume, which typically compares activity to a time-of-day baseline rather than to a recent moving average.
The instrument's quirks come from its input. Volume series are spiky, so a single climactic print inflates the fast average for days, and intraday volume follows a strong session curve that a plain moving-average baseline does not know about, morning readings run hot and lunchtime readings cold by schedule alone. Users either restrict intraday readings to like-for-like comparisons, hand the time-of-day problem to relative-volume tools, or accept the oscillator as a daily-chart instrument where the session curve averages out.
How to read the Volume Oscillator
The oscillator plots around zero beneath the chart; every reading is a comparison against the instrument's own recent baseline.
- 1Add the oscillator with its two lengths (a short average near 5 against a longer one of 10 to 20 is common; percentage form recommended).
- 2Read the sign: positive means activity is running above its recent baseline, negative below; neither says anything about price direction.
- 3Read the slope: participation building or fading is often the more useful information, especially around developing price events.
- 4Pair each reading with the price event it accompanies: expansion on a range break supports the move, expansion during a decline marks urgency, contraction during a pullback reads corrective.
- 5Intraday, respect the session curve: compare readings with the same time of day, or lean on relative-volume tools for that job.
- 6Expect spike distortion: a climactic print inflates the fast average for days (volume spikes deserve their own read), so interpret the aftermath accordingly.
How it's calculated
Shows how far short-term volume is running above or below longer-term volume, expressed in percent.
Some platforms use SMAs instead of EMAs, or plot the raw difference FastMA_t - SlowMA_t without dividing.
The Percentage Volume Oscillator (PVO) is the same construction with EMA lengths 12 and 26 plus a 9-bar signal EMA.
Values above zero mean recent volume is running above its longer-term average; the line says nothing about price direction.
How traders use it
- To qualify breakouts: a positive, rising oscillator while price clears a level indicates participation behind the move, the same logic as checking volume at breakout; a break on a negative oscillator is treated with more suspicion.
- To read pullbacks: volume contracting while price drifts against the prevailing trend is consistent with a corrective pause, while expanding volume against the trend is a stronger warning.
- As a regime read: sustained positive values mark an active, expanding market, while sustained negative values mark quiet conditions, which some traders use as a cue to stand aside or expect rotation rather than follow-through.
- As machinery inside divergence detection: mechanized volume divergence tools often compare price pivots against a volume oscillator rather than raw volume, letting the smoothing suppress single-bar noise before the comparison.
- In MACD-style form: adding a signal line to the oscillator gives crossing events that mark participation turning up or down, used as timing refinements on volume-confirmation rules rather than as standalone triggers.
Volume Oscillator vs other activity gauges
Relative Volume: Relative volume compares activity against a time-of-day baseline, answering whether this hour is busy for this hour. The oscillator compares against a recent moving average, answering whether the market is busier than its recent self. Intraday, the first is the fairer judge.
OBV: OBV signs volume by close direction and accumulates it into a flow line, blending price into the reading. The volume oscillator keeps volume unsigned and measures only expansion versus contraction, leaving direction entirely to price analysis.
Volume Spike: Spike detection flags single extraordinary prints, the events; the oscillator tracks the continuous state of participation between them. A spike bends the oscillator for days, which is precisely the difference between an event detector and a state gauge.
Concept family
Volume & Order Flow
88 concepts mapped · 88 in the Library
Volume Oscillator FAQ
Turn Volume Oscillator into a trading strategy.
Take the implementation from this page into Quant, then build on it, backtest it on real data, and keep refining it in conversation.