Dynamic S/R Via MA
Dynamic S/R Via MA is a Trend concept. The Library holds 3 implementations, each one a working definition you can pull into Quant.
e.g. 20 EMA bounce
Top Dynamic S/R Via MA indicators
The top custom implementations, built on the original standard Dynamic S/R Via MA formula.
3 total
Want to trade Dynamic S/R Via MA? Any of the 3 implementations below is one prompt away from a backtested strategy in Quant.
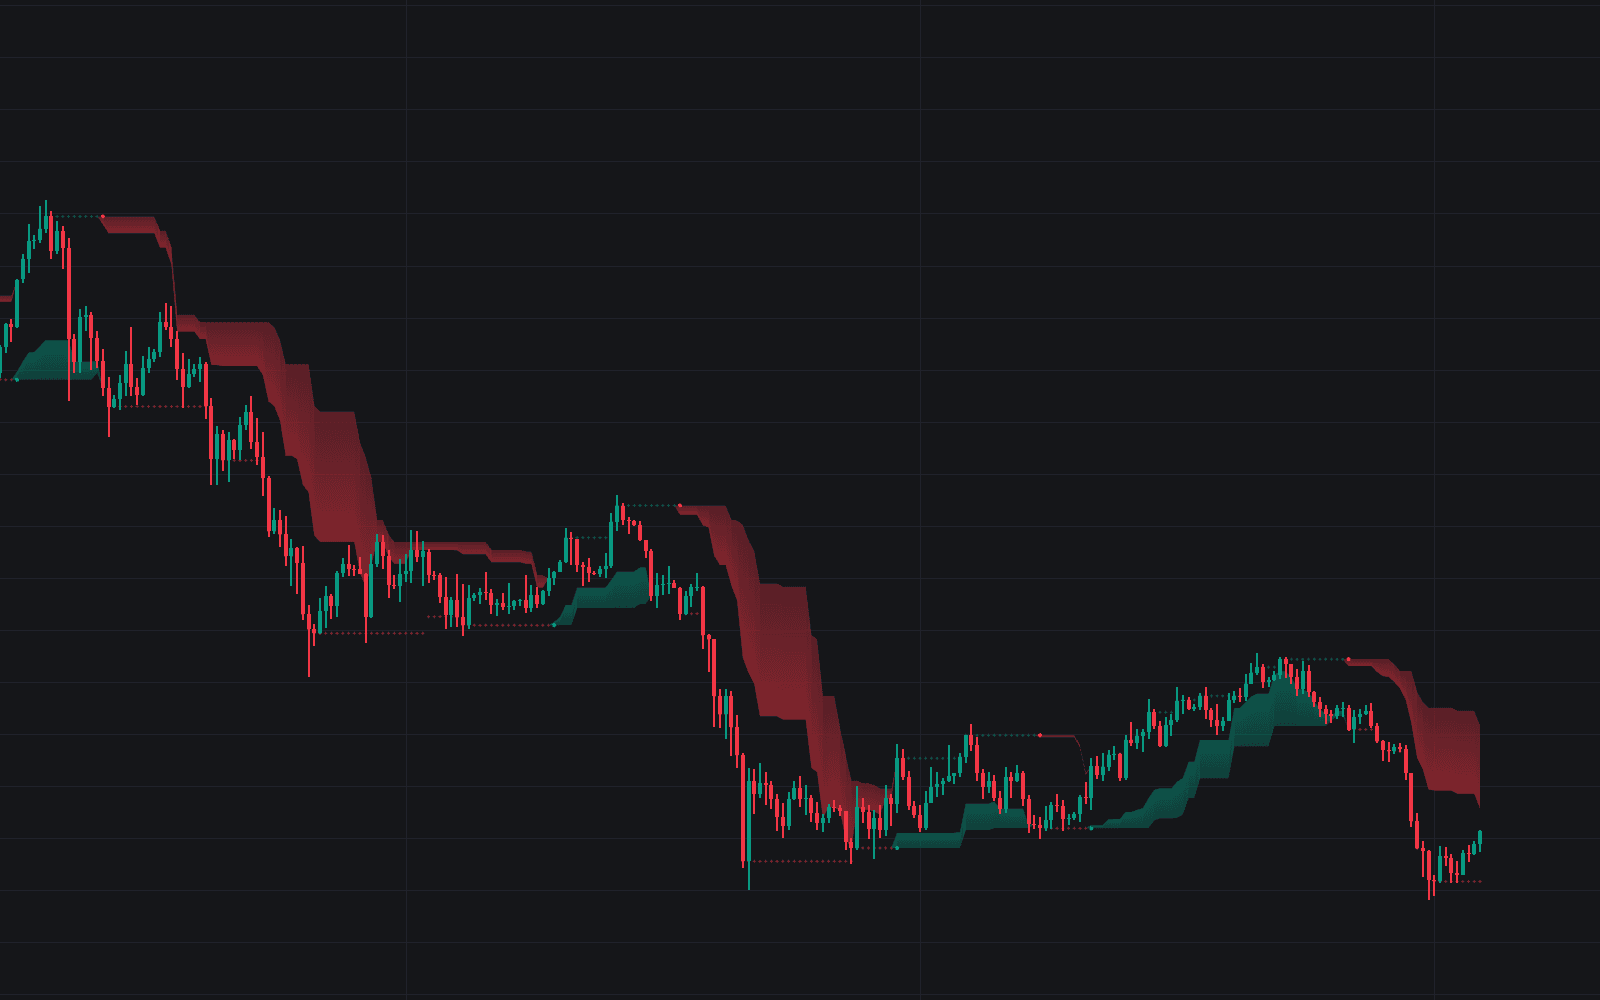
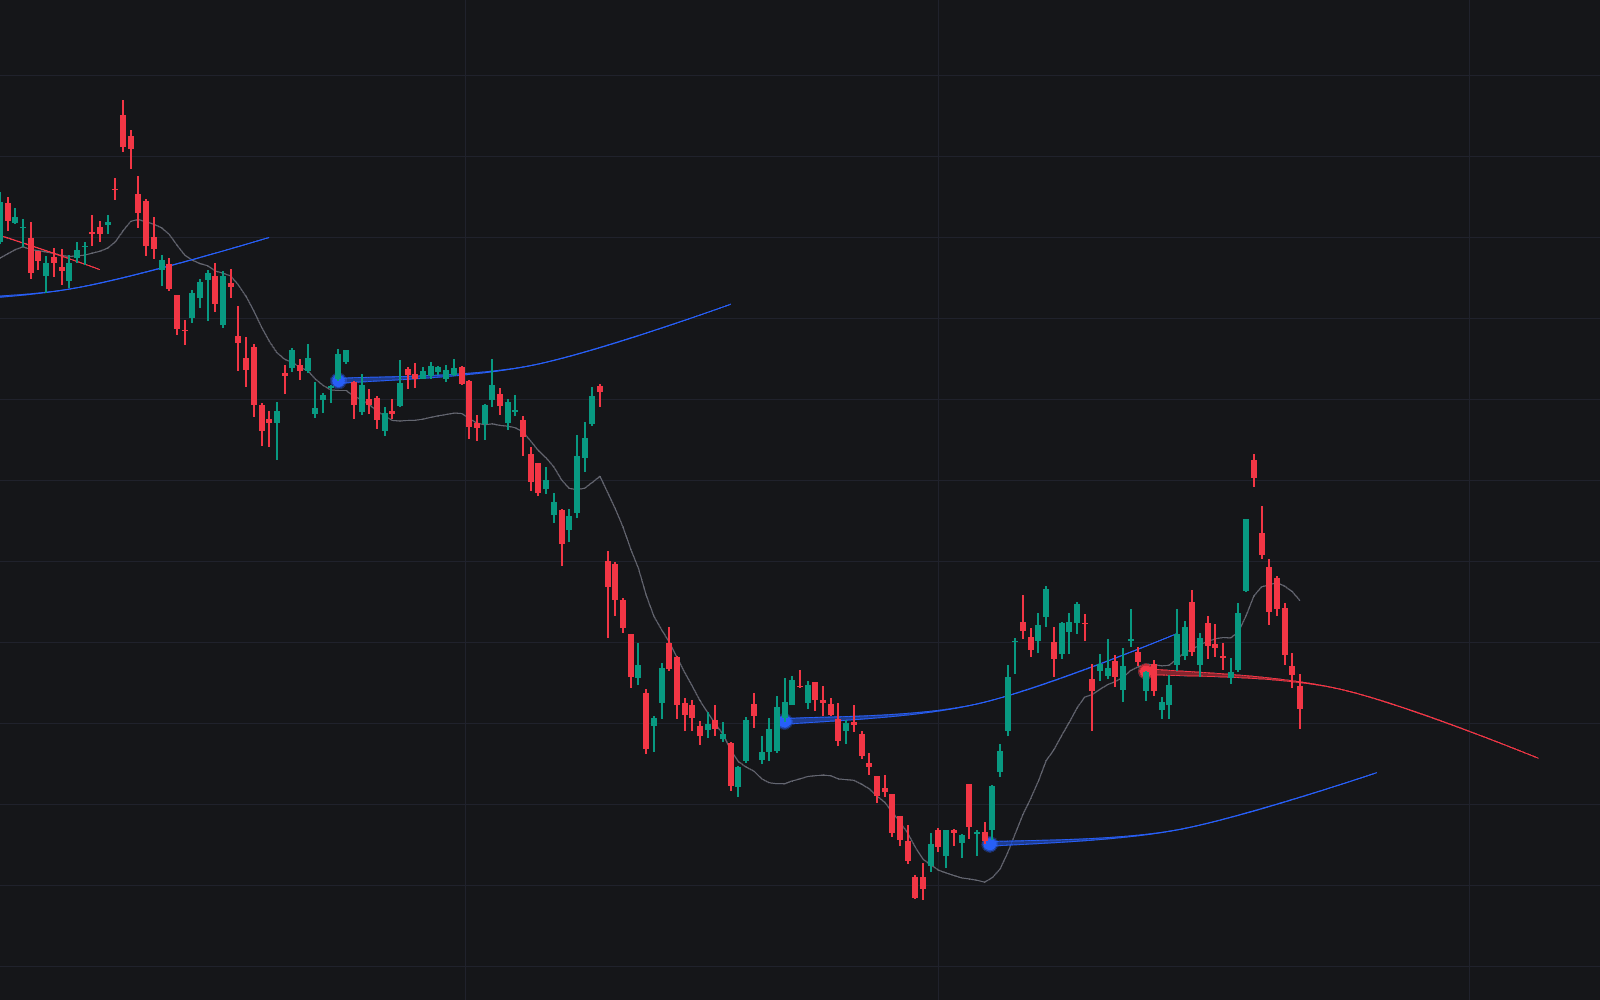
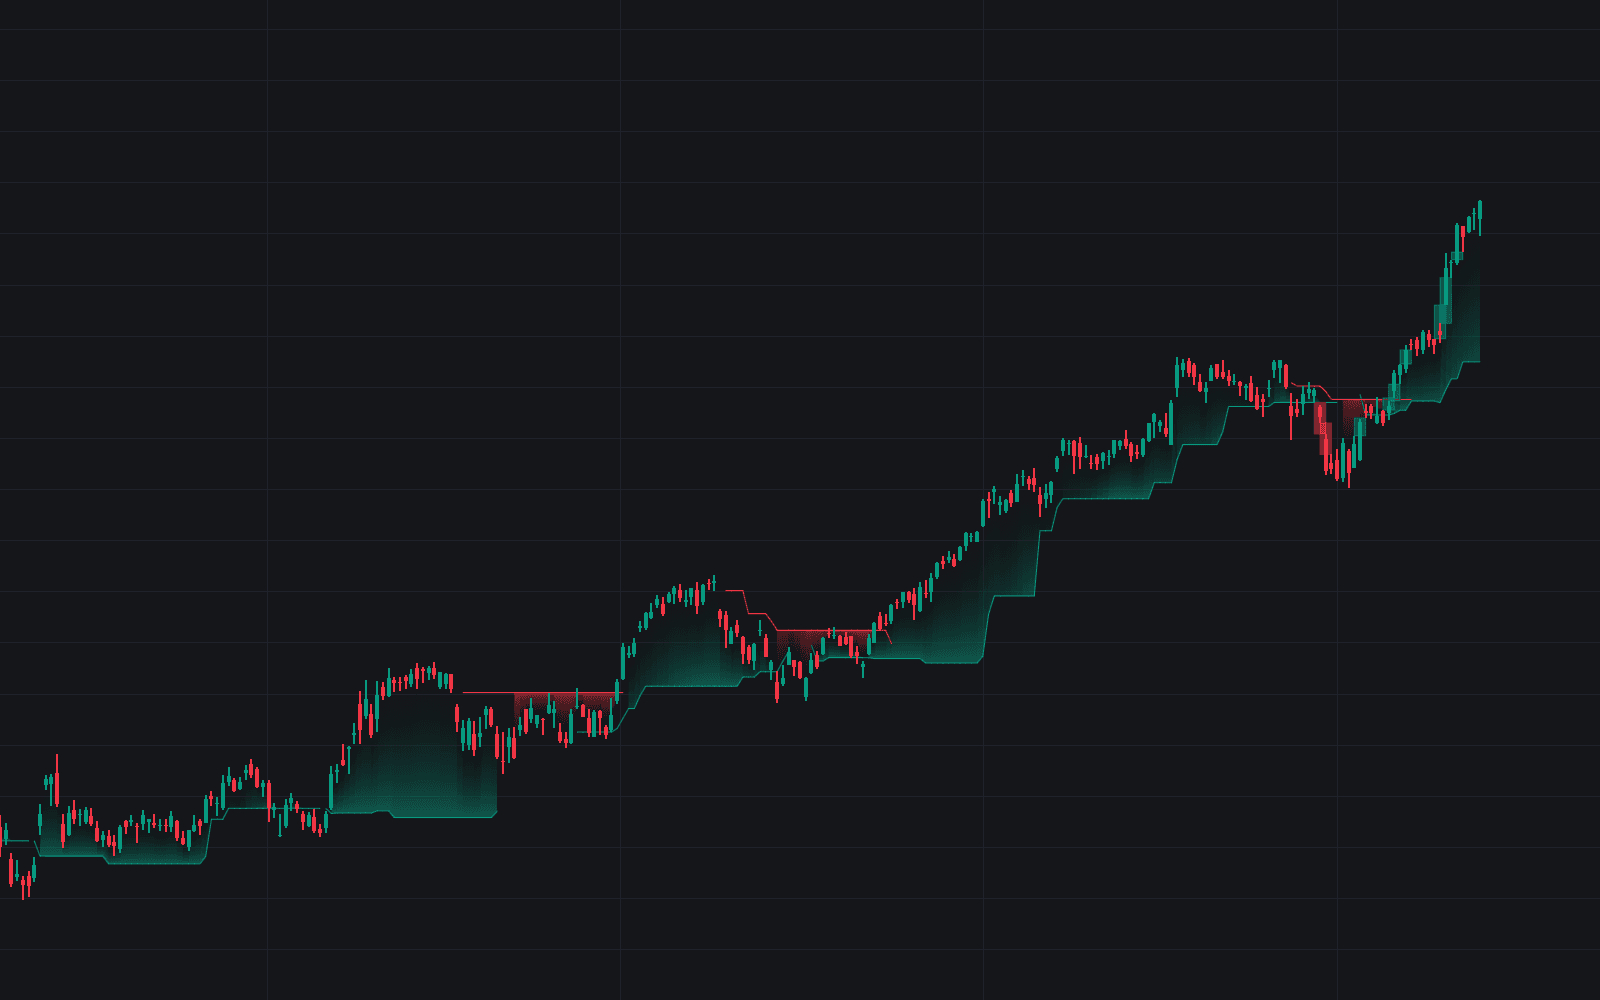
What is Dynamic S/R Via MA?
Dynamic S/R via MA treats a moving average as support or resistance that moves with price instead of sitting at a fixed level. In an uptrend, pullbacks often stall around a widely watched average such as the 20-period EMA or the 50-period SMA and the trend resumes; in a downtrend the same averages cap rallies. 'Dynamic' is literal: the level is recalculated every bar, so it follows the trend without ever being redrawn.
The mechanism is part geometry, part attention. An average tracks the mean of recent closes, so a pullback to it is a return toward recent value; and because defaults like 20, 50, and 200 are watched by many participants, orders tend to gather around them, which makes the reaction partly self-fulfilling. Neither force is precise. Price respects the area around the line rather than the exact tick, and in ranges it crosses the average constantly without any reaction at all.
The idea matters because it gives trend traders a reference that keeps up with the move: a place to stage entries, trail risk, and judge trend health without repeatedly redrawing horizontal levels. The honest caveat is that a touch is not a signal. Averages fail to hold routinely, especially as trends age, so most approaches treat the touch as location and require a visible reaction before acting.
How to read dynamic S/R via MA
The technique only means something in a trend, so establish that first, then watch how price behaves on each approach to the average.
- 1Confirm the trend on your timeframe: a rising average with price making higher highs and higher lows for support reads, the mirror image for resistance reads. In a sideways range the average is just the middle of the chop.
- 2Choose an average participants actually watch there: the 20/21 EMA for fast trends, the 50 SMA for intermediate ones, the 200 for the major regime. The exact choice matters less than applying it consistently.
- 3Watch the reaction, not the touch: useful holds show rejection, long wicks back in the trend direction, an engulfing close, or a stall and turn, while repeated closes through the line warn that the trend is losing its carrier.
- 4Treat the line as a zone with tolerance on both sides, since strong trends often turn just before tagging it and deep pullbacks pierce it intrabar without invalidating the hold.
How it's calculated
A moving average line read as support when price trades above it and as resistance when price trades below it, updating with every bar.
The level is dynamic because it is recomputed each bar instead of being fixed at a past price.
The 50 and 200 period SMAs and the 20 period EMA are the most watched settings; longer averages act as slower, stronger levels.
Touch tests usually allow a small tolerance band around MA_t, a percent of price or an ATR fraction, since exact tags are rare.
How traders use it
- Trend-pullback entries: buying a retracement into a rising average (the classic 20 EMA bounce) or shorting a rally into a falling one, with a candlestick or structure trigger doing the actual timing rather than the touch itself.
- Trailing exits: once an average has carried the trend through several touches, a decisive close beyond it becomes the exit or tightening trigger, a moving cousin of the structure stop.
- Role reversal reads: an average that supported the trend flipping to resistance after a break (or the reverse) is evidence the regime has changed, the dynamic equivalent of a broken horizontal level changing sides.
- Confluence stacking: an average landing on a horizontal level, a Fib retracement, or a prior breakout point makes the zone more interesting than any single reference; on its own, an MA touch is weak evidence.
Dynamic S/R Via MA vs. related concepts
S/R Zone: A horizontal zone is anchored to specific past reaction points and stays where it was drawn. A moving average has no memory of any particular level; it recalculates every bar and follows price.
Trendline: A trendline is also diagonal, but its slope is fixed by the swings used to draw it. An average curves with the data, never needs redrawing, and bends through accelerations a straight line cannot follow.
Anchored VWAP: Both produce moving reference lines, but anchored VWAP is volume-weighted from a chosen event and represents the average price paid since that anchor. A plain moving average weights closes over a rolling window with no volume input and no anchor.
MA Envelope: An envelope offsets bands a fixed percentage around the average and trades the distance from it. Dynamic S/R trades interactions with the average itself.
Concept family
Trend
104 concepts mapped · 104 in the Library
Dynamic S/R Via MA FAQ
Turn Dynamic S/R Via MA into a trading strategy.
Take any implementation from this page into Quant, then build on it, backtest it on real data, and keep refining it in conversation.