VPCI
VPCI, also known as volume price confirmation indicator, is a Volume & Order Flow concept. The Library holds 1 implementation, a working definition you can pull into Quant.
Top VPCI indicator
The top custom implementation, built on the original standard VPCI formula.
1 total
The VPCI implementation below can become a backtested trading strategy — describe your rules and Quant writes the code.
What is the Volume Price Confirmation Indicator (VPCI)?
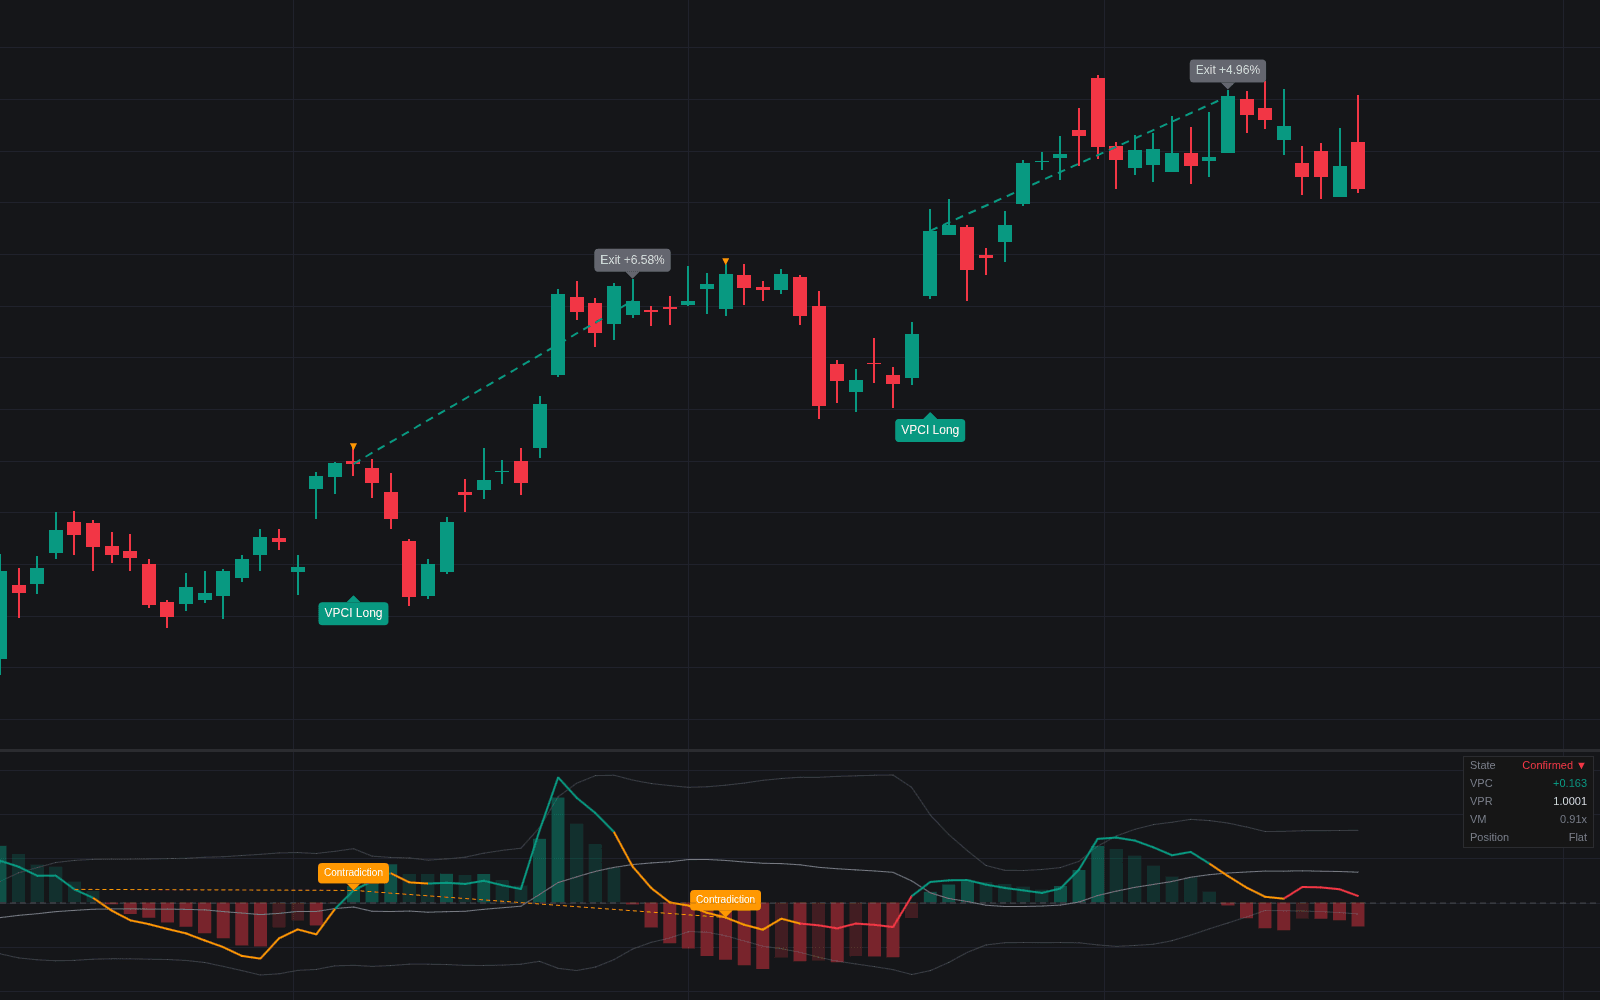
The Volume Price Confirmation Indicator (VPCI) is Buff Pelz Dormeier's measure of whether volume confirms or contradicts the price trend. It compares volume-weighted and simple moving averages of the same length: when a window's heavier volume traded at higher prices, the VWMA sits above the SMA, and the gap is read as volume supporting the advance. VPCI multiplies that long-window gap by two short-window factors, so recent shifts in volume amplify or damp the reading.
Dormeier, a Chartered Market Technician, introduced the indicator in 'Between Price and Volume' (Technical Analysis of Stocks & Commodities, July 2007); his paper on it received the 2007 Charles H. Dow Award, and he expanded on it in Investing with Volume Analysis (2011). His framing is confirmation versus contradiction: price and VPCI rising together describe an advance that volume supports, while price rising as VPCI falls describes one that volume is not backing.
How it's calculated
VPCI is the product of three moving-average comparisons. Dormeier defined the components; the window lengths are inputs.
VPC carries the sign; VPR and VM are positive scale factors that amplify or damp it.
Because VPC is a price difference, raw VPCI scales with the instrument's price, so readings compare within one chart rather than across symbols.
Many implementations add a signal line, a moving average of VPCI, for crossover signals.
How traders use it
- Trend confirmation: a rising VPCI alongside rising price says the advance is drawing its volume at higher prices, a reason to stay with the trend rather than an entry trigger.
- Contradiction warnings: new price highs while VPCI declines is the indicator's version of volume divergence, a sign that participation is not following price.
- Mechanical triggers: crosses of VPCI over its own moving average, and through zero, are the common signal rules.
- As a filter for other signals: Dormeier's 2007 article paired it with MACD crossovers, using VPCI readings to confirm or veto them.
- With care in declines: falling-market readings are less intuitive, and Dormeier later revised his own description of the falling-price cases, so downtrend signals deserve extra testing.
VPCI vs related volume tools
VWMA: VPCI's raw material. Comparing a VWMA with a same-length SMA gives the basic confirmation read; VPCI formalizes that gap and scales it by short-term volume behavior.
Volume Divergence: The qualitative read of shrinking participation into new extremes. VPCI turns the same question into a continuous line that can be crossed, thresholded and tested.
OBV: OBV accumulates whole-bar volume by close direction and is read through its slope and divergences. VPCI measures where volume traded within rolling windows, so it has no arbitrary starting point to drift from.
Concept family
Volume & Order Flow
91 concepts mapped · 91 in the Library
VPCI FAQ
Turn VPCI into a trading strategy.
Take the implementation from this page into Quant, then build on it, backtest it on real data, and keep refining it in conversation.